About me
My name is Mark Marji. I graduated from the University of Kentucky with my Masters degree in Applied Environmental and Sustainability Science (Applied ENS) and did an internship with the Linguistic Atlas Project while completing my Masters. In March 2024, I received my graduate degree in digital mapping. Additionally, I earned a Bachelor of Science in Digital Media and Design in 2022.
Skills
-
GIS
I have experience in operating and creating GIS maps using the QGIS program. I'm also skilled in changing the projection of the map along with the CRS (coordinate reference system).
-
Coding
I have experience in coding with the use of GitHub. I have knowledge in using the VS Code to create an index and the GitHub Desktop to save what I have done. I have also learned how to do a JavaScript and CSS file by using the VS Code.
-
ArcGIS
I gained a hands-on experience with ArcGIS and ArcGIS Pro, utilizing its tools for spatial analysis, data visualization, and mapping. I used ArcGIS to create impactful geospatial outputs, such as detailed maps, choropleth maps, and spatial models to support data-driven insights and decision-making.
GitHub Projects
Hawaii Lava Flow Project
This map focuses on the volcano lava flow hazard locations which involves the roads in each area. It showcases which area has the most hazard and how it affects the roads. This link shows the steps on how this project was done.
Places of Interest In DC
This map shows some of the museums located in Washington DC. There are several other museums located in the area (for a complete list, see here).
Kenya Mapbox
This is a Monochrome mapbox that shows a map of Kenya. This was used for two modules for MAP 673 (Module 4 and Module 5). Features of this map include administrative boundaries, greenspace, place labels, and water.
NYC Subway Museum Map
A map that shows the museums around the New York City area and which subway lines are best used to get to whichever specific museum. This is the final project I did for MAP 672.
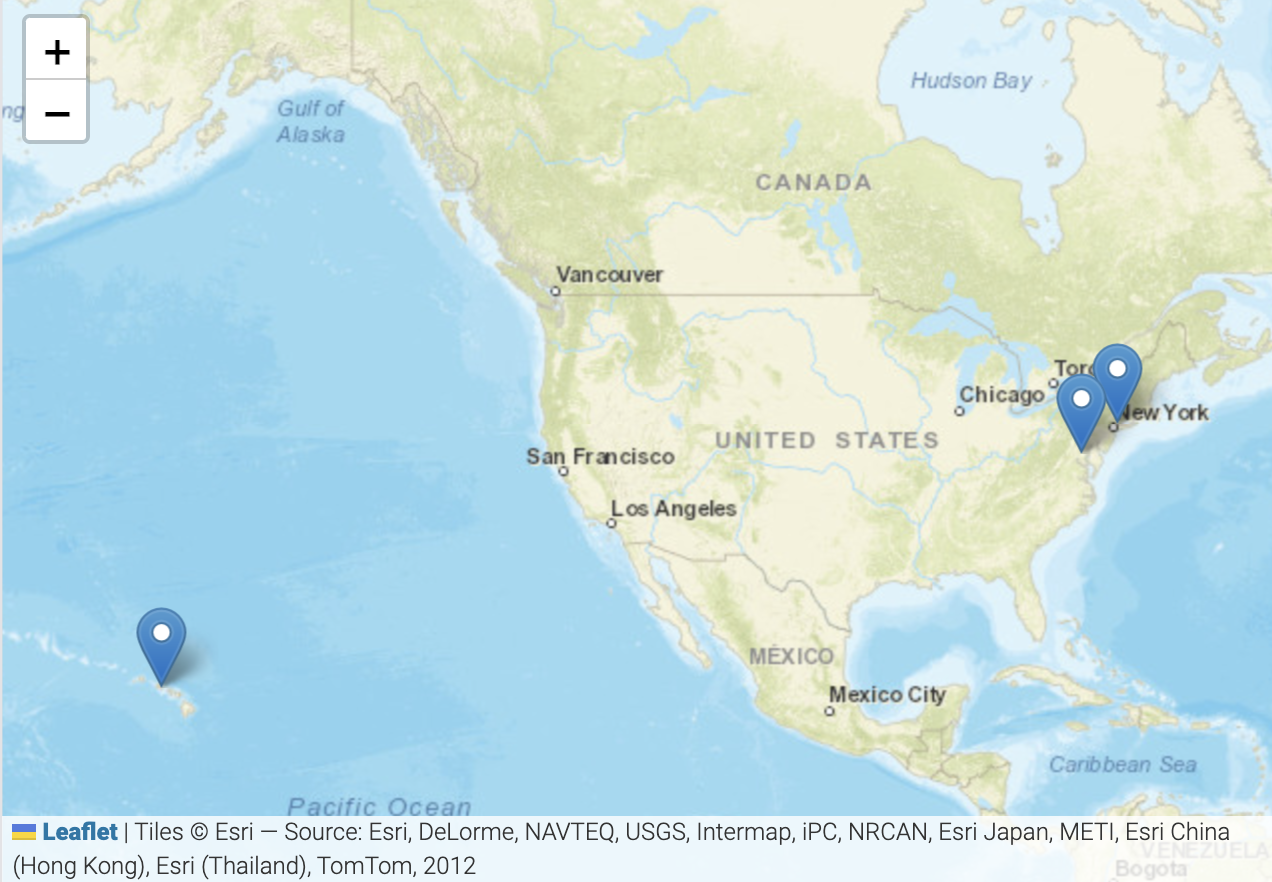
JavaScript Placemark Map
This map demonstrates using JavaScript to place map markers with tooltips (or popups) with meaningful information using array data structures, for loops, and if/else statements.

Waihou Solar Power Plants
This map focuses on the solar energy production in Hawaii and is mainly centered around the Oahu area of Waihonu. The map features two solar panels, the Waihonu North Solar and Waihonu South Solar.
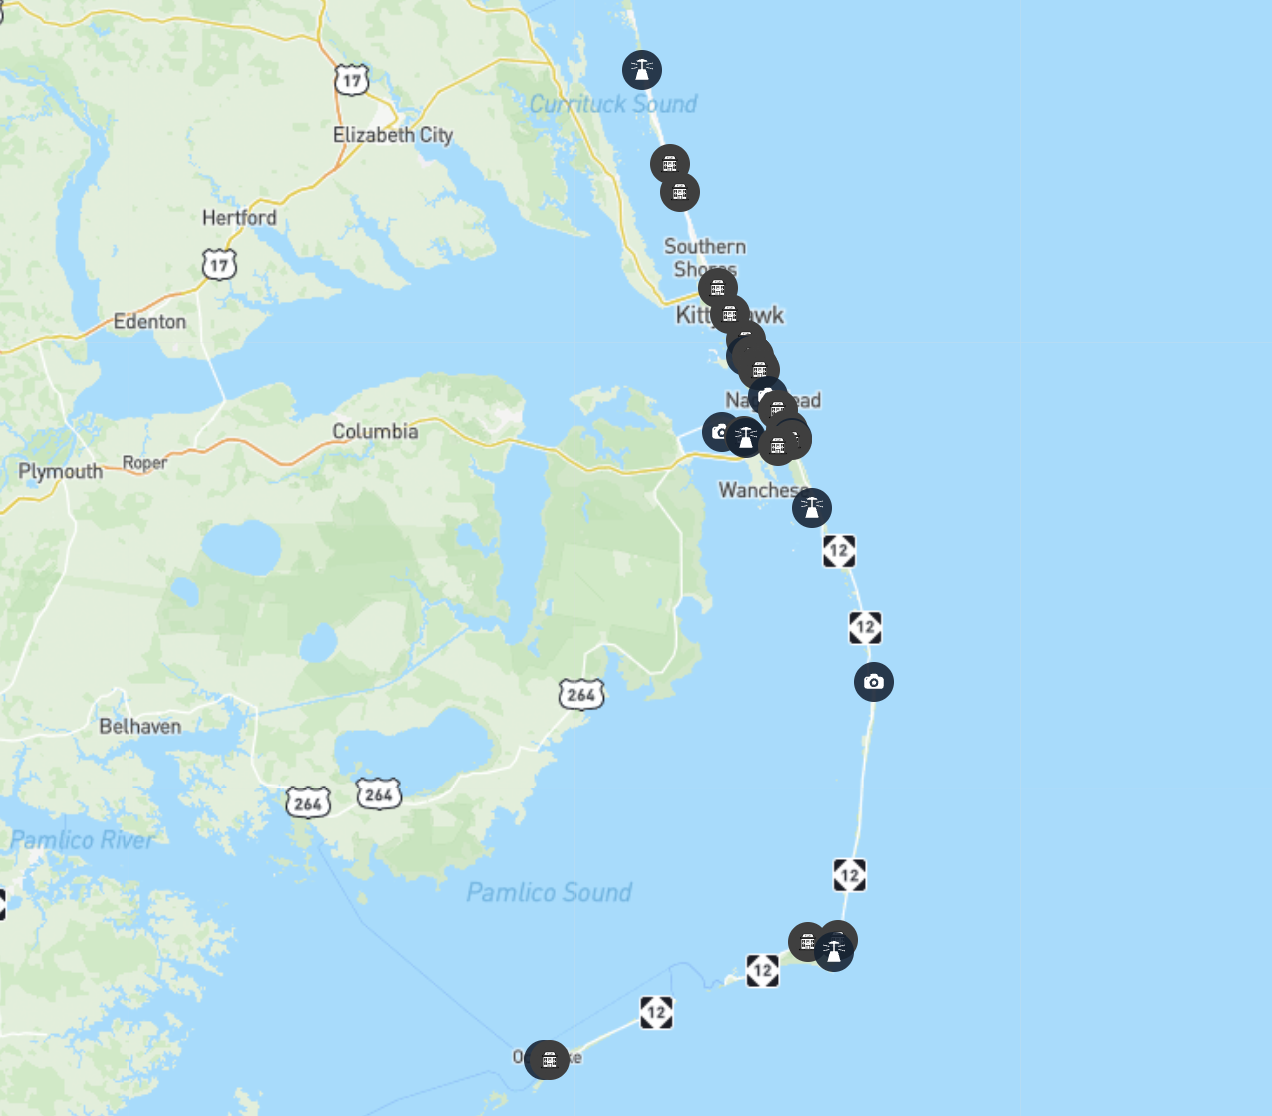
Outer Banks Project
This map is the my final project for MAP 673. This final project focuses on the Outer Banks and includes the use of SVG icons to represent the attractions and three data sources that serves as a guide to this.
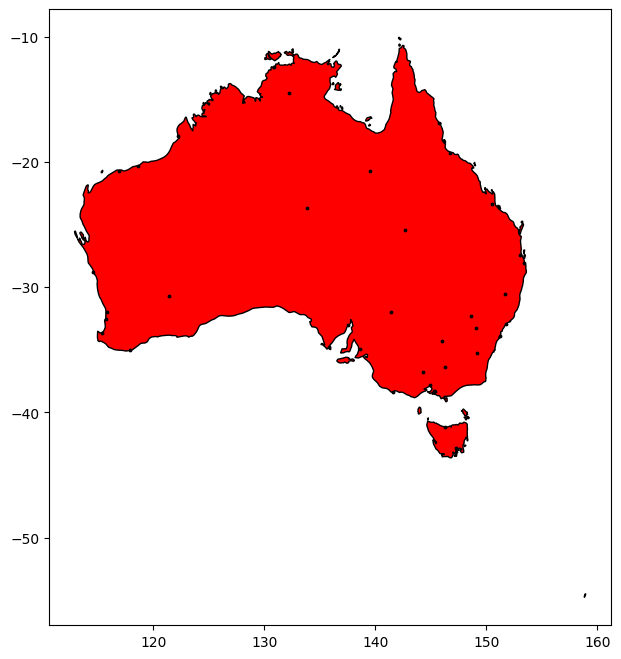
Electricity Consumption Sectors of Sydney
This is the final project for MAP 674. It focuses on Australia, especially the Electricity Consumption Sectors of Sydney. It focuses on the use of Jupyter Notebook files that are used to create the project. This is the link to where the Python files are located.
Linguistic Atlas Project Internship Work
Informant Map Version 1
This map features coordinates and is version 1 of the informant map, which is part of the LAMSAS project internship, which is called the Linguistic Atlas Project.
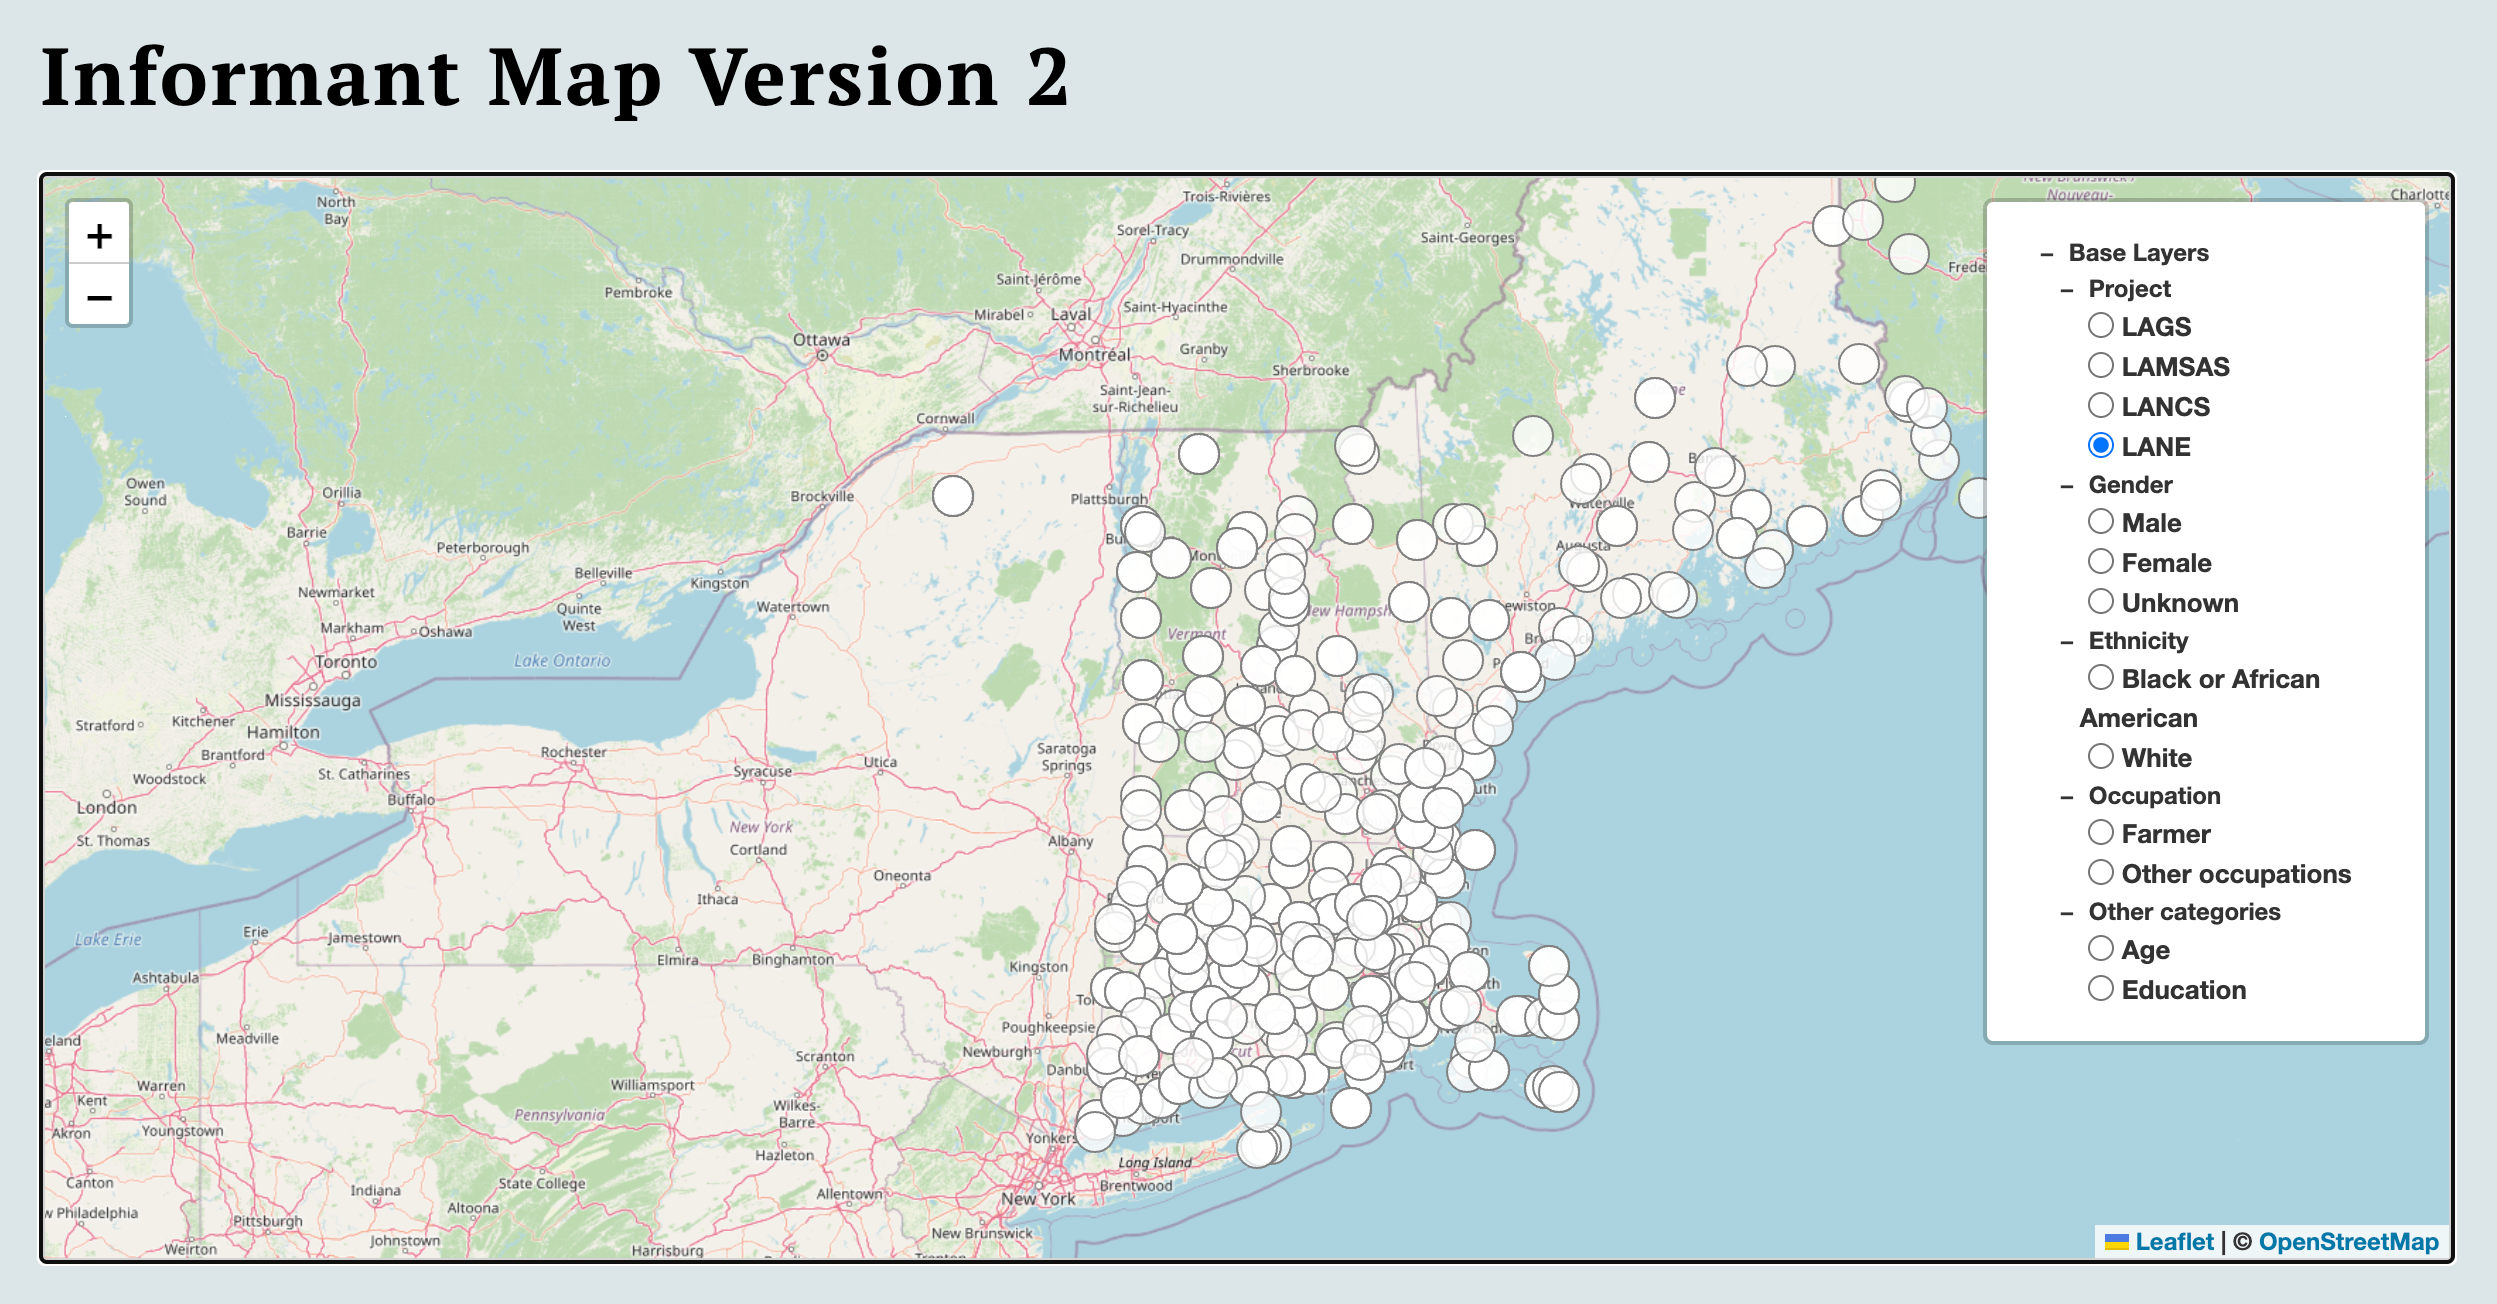
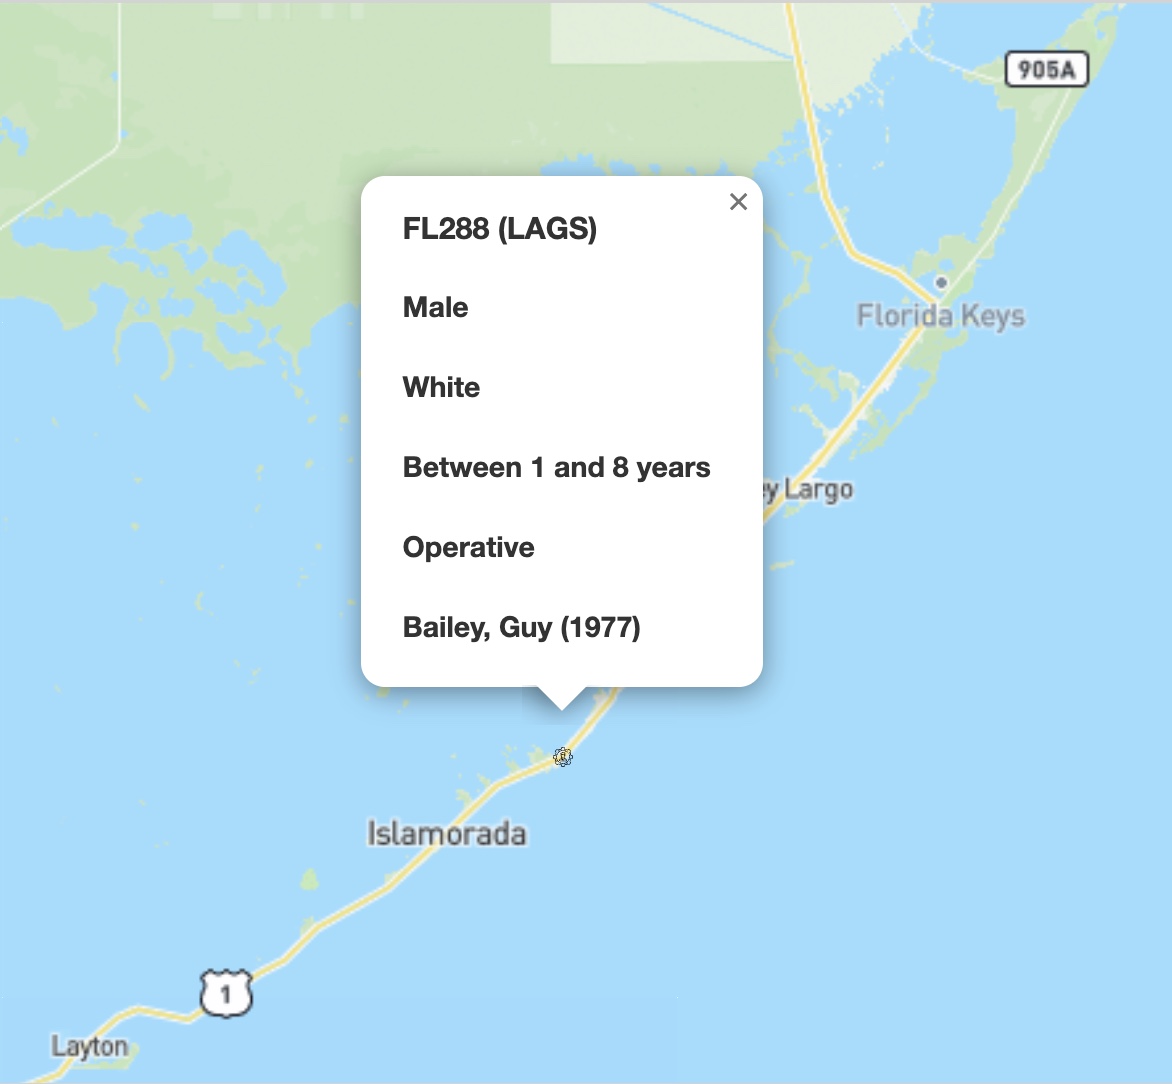
Informant Map Version 2
This map includes information about the informant number and a job icon. Sex, ethnicity, educational attainment, occupation, and fieldworker year of interview will all be included in the information.
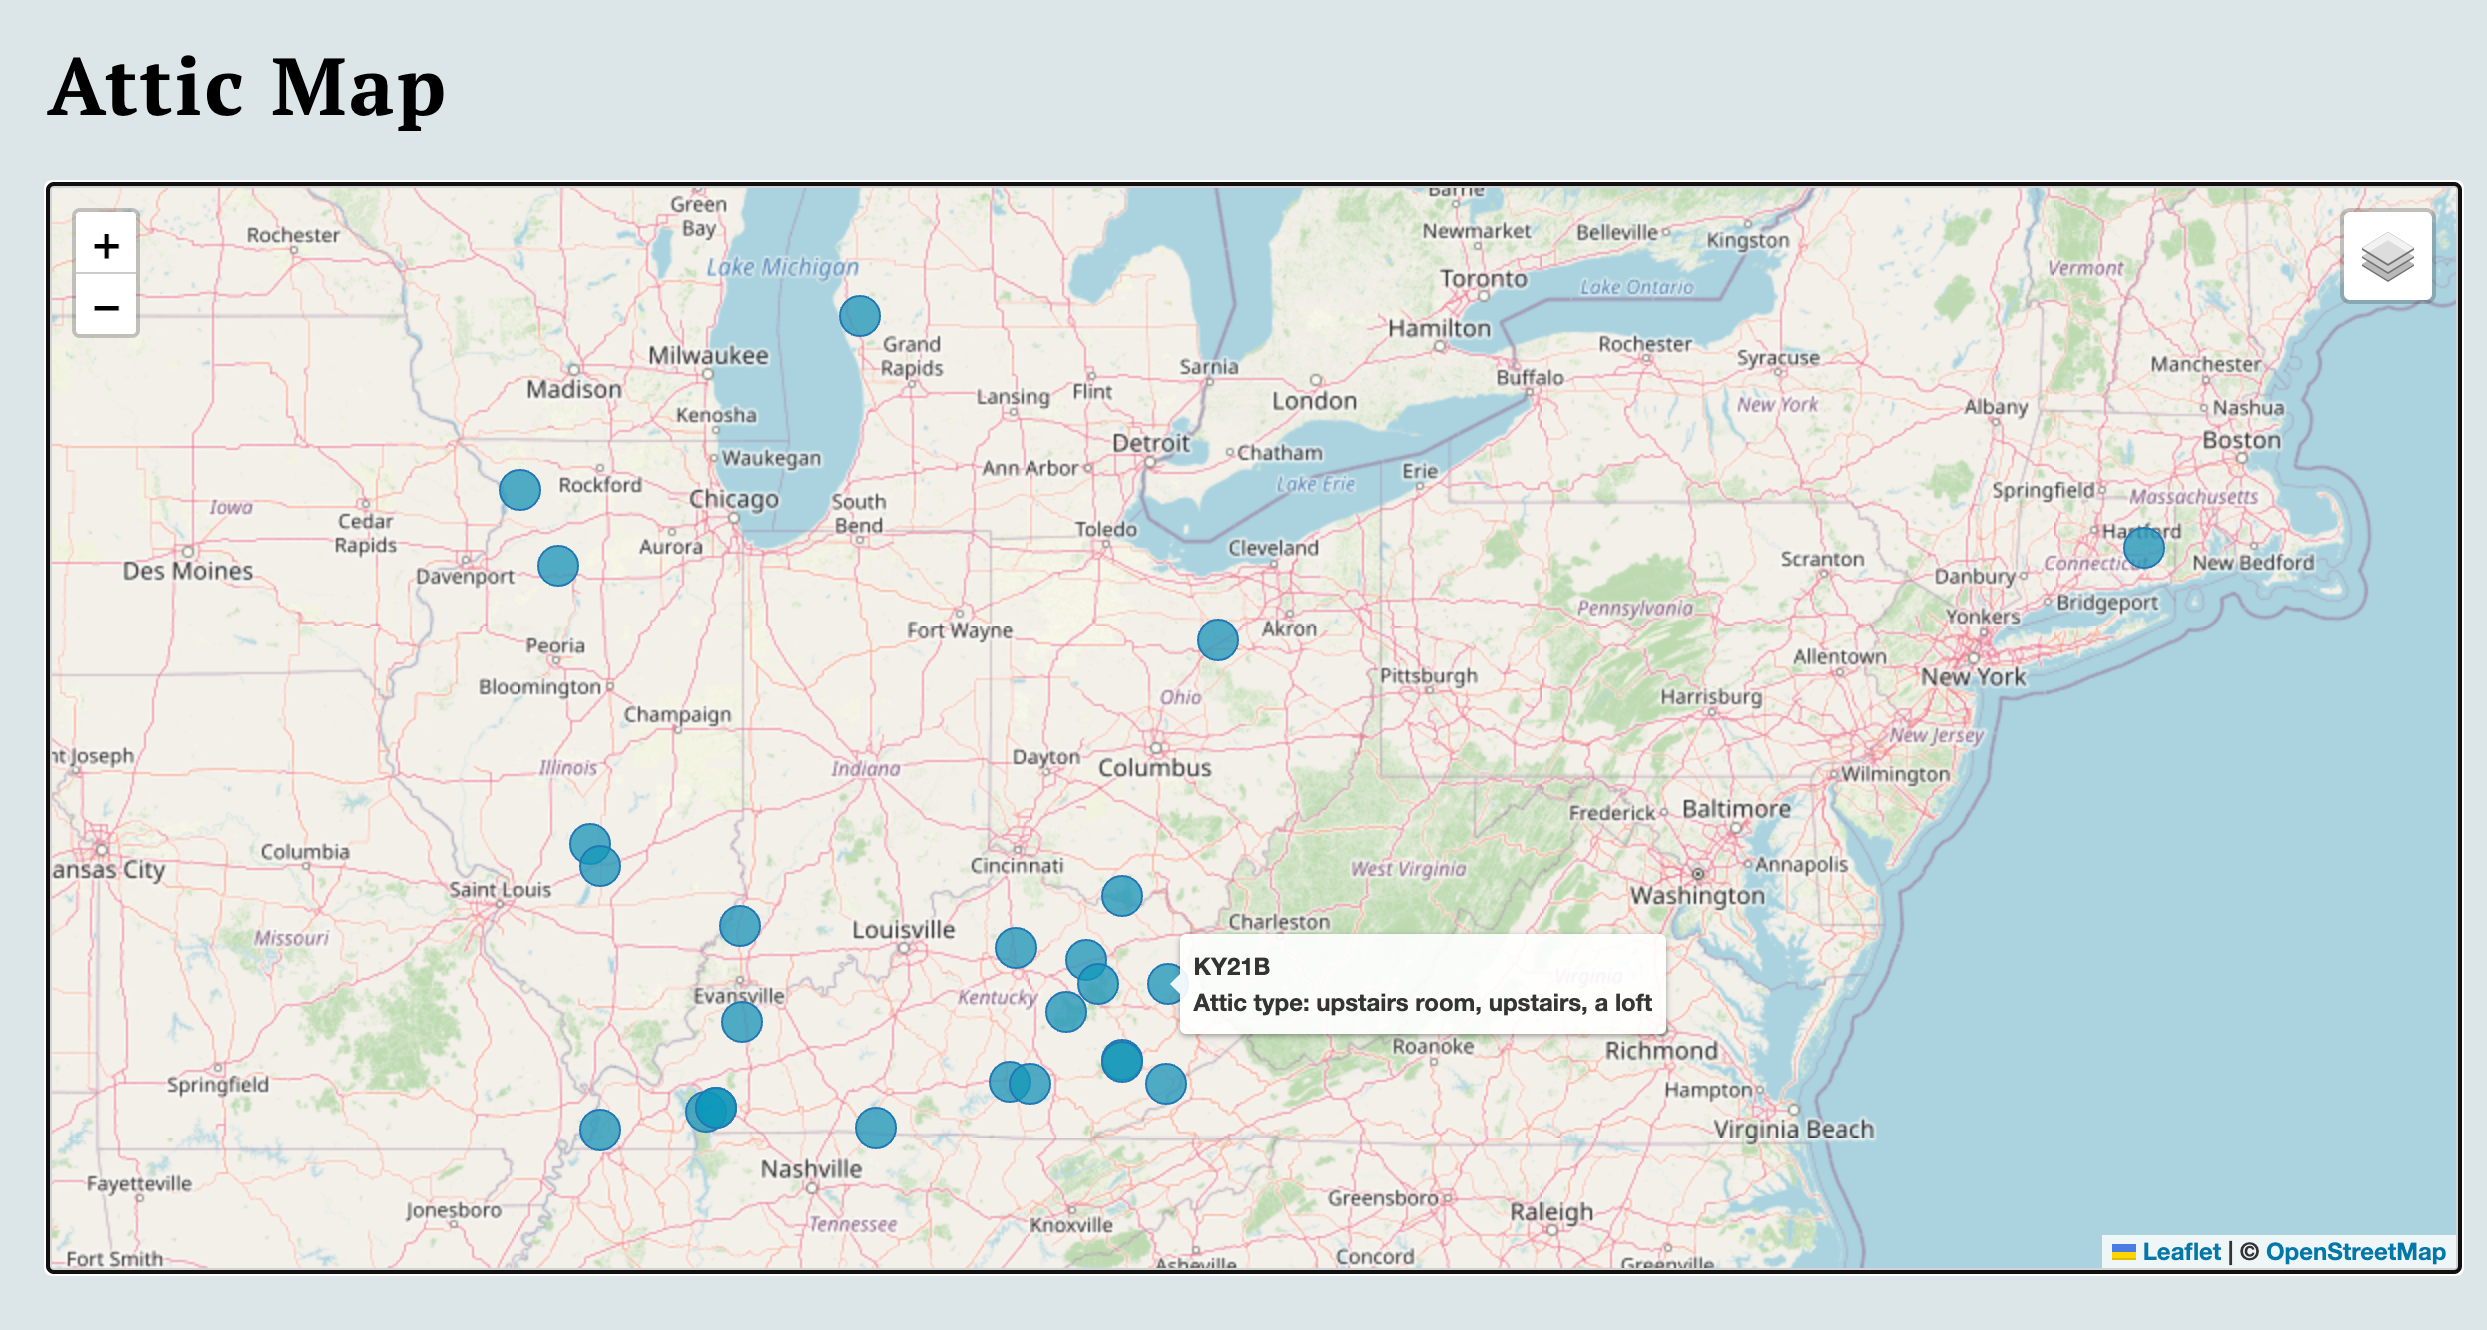
Informant Map Version 3
This is Version 3 of the Informant Map of the Linguistic Atlas Project, which contains checkboxes of different attics.
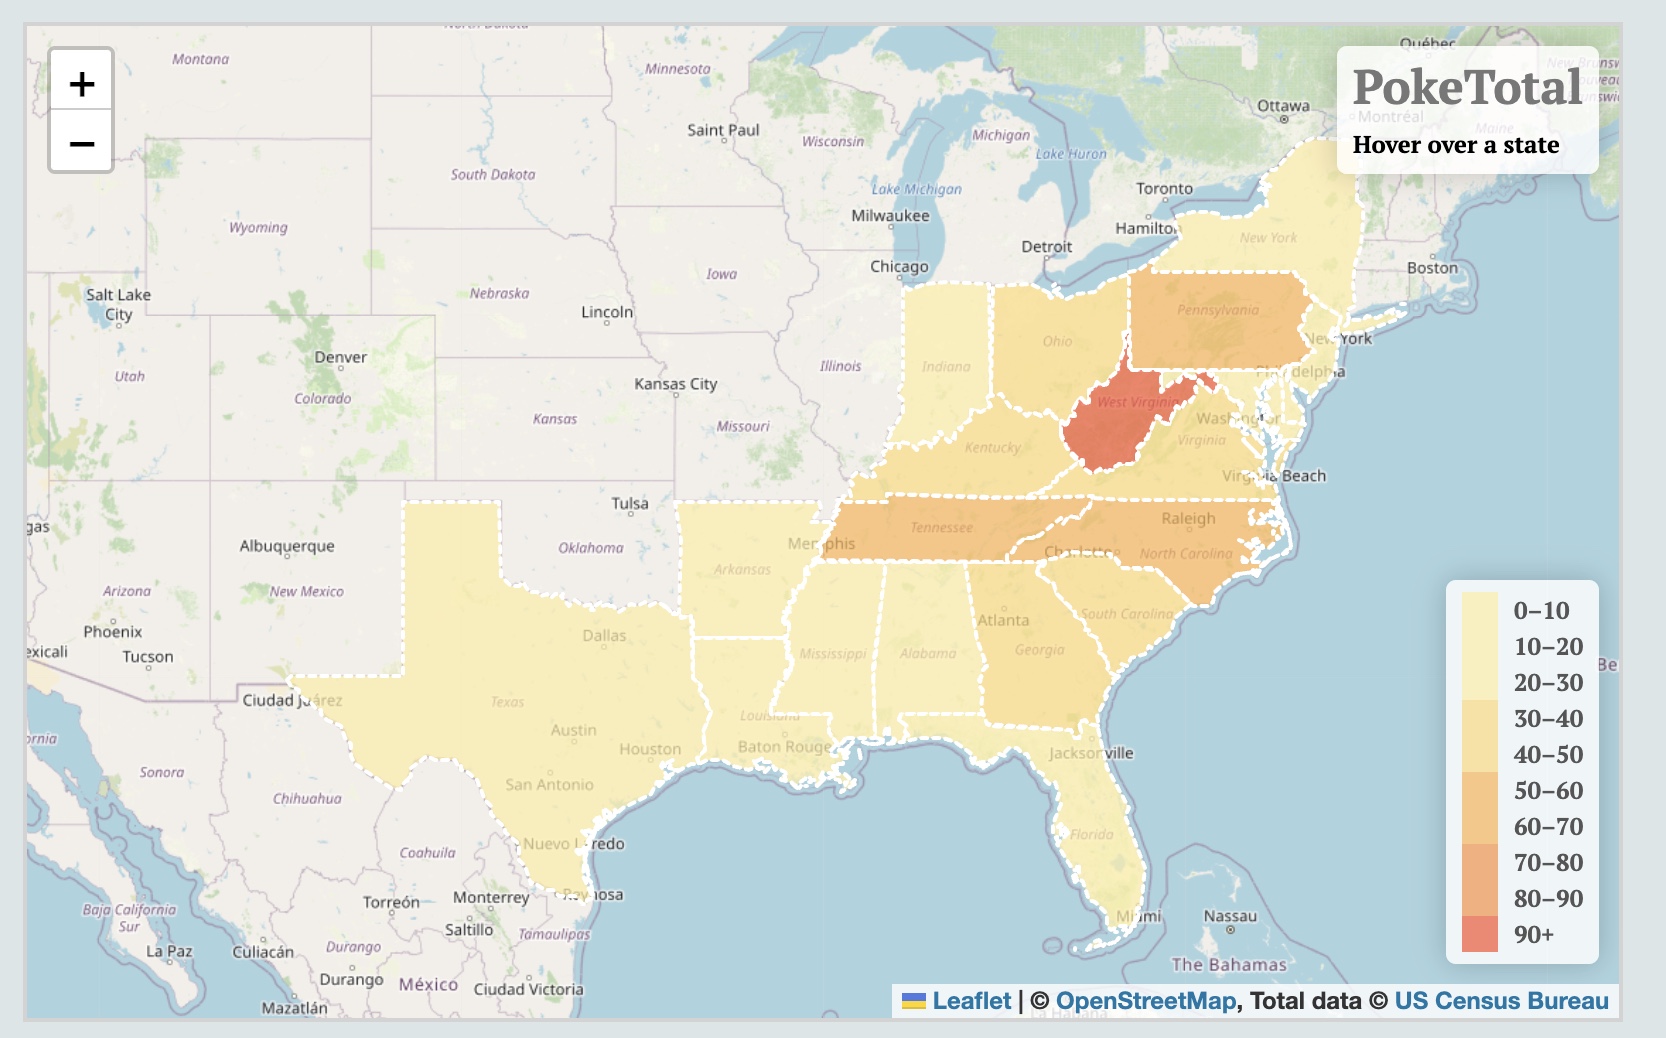
PokeSackTotal
This map consists of several files of different types of bags. They include pokes (found commonly in appalachia United States), sacks, and bags.
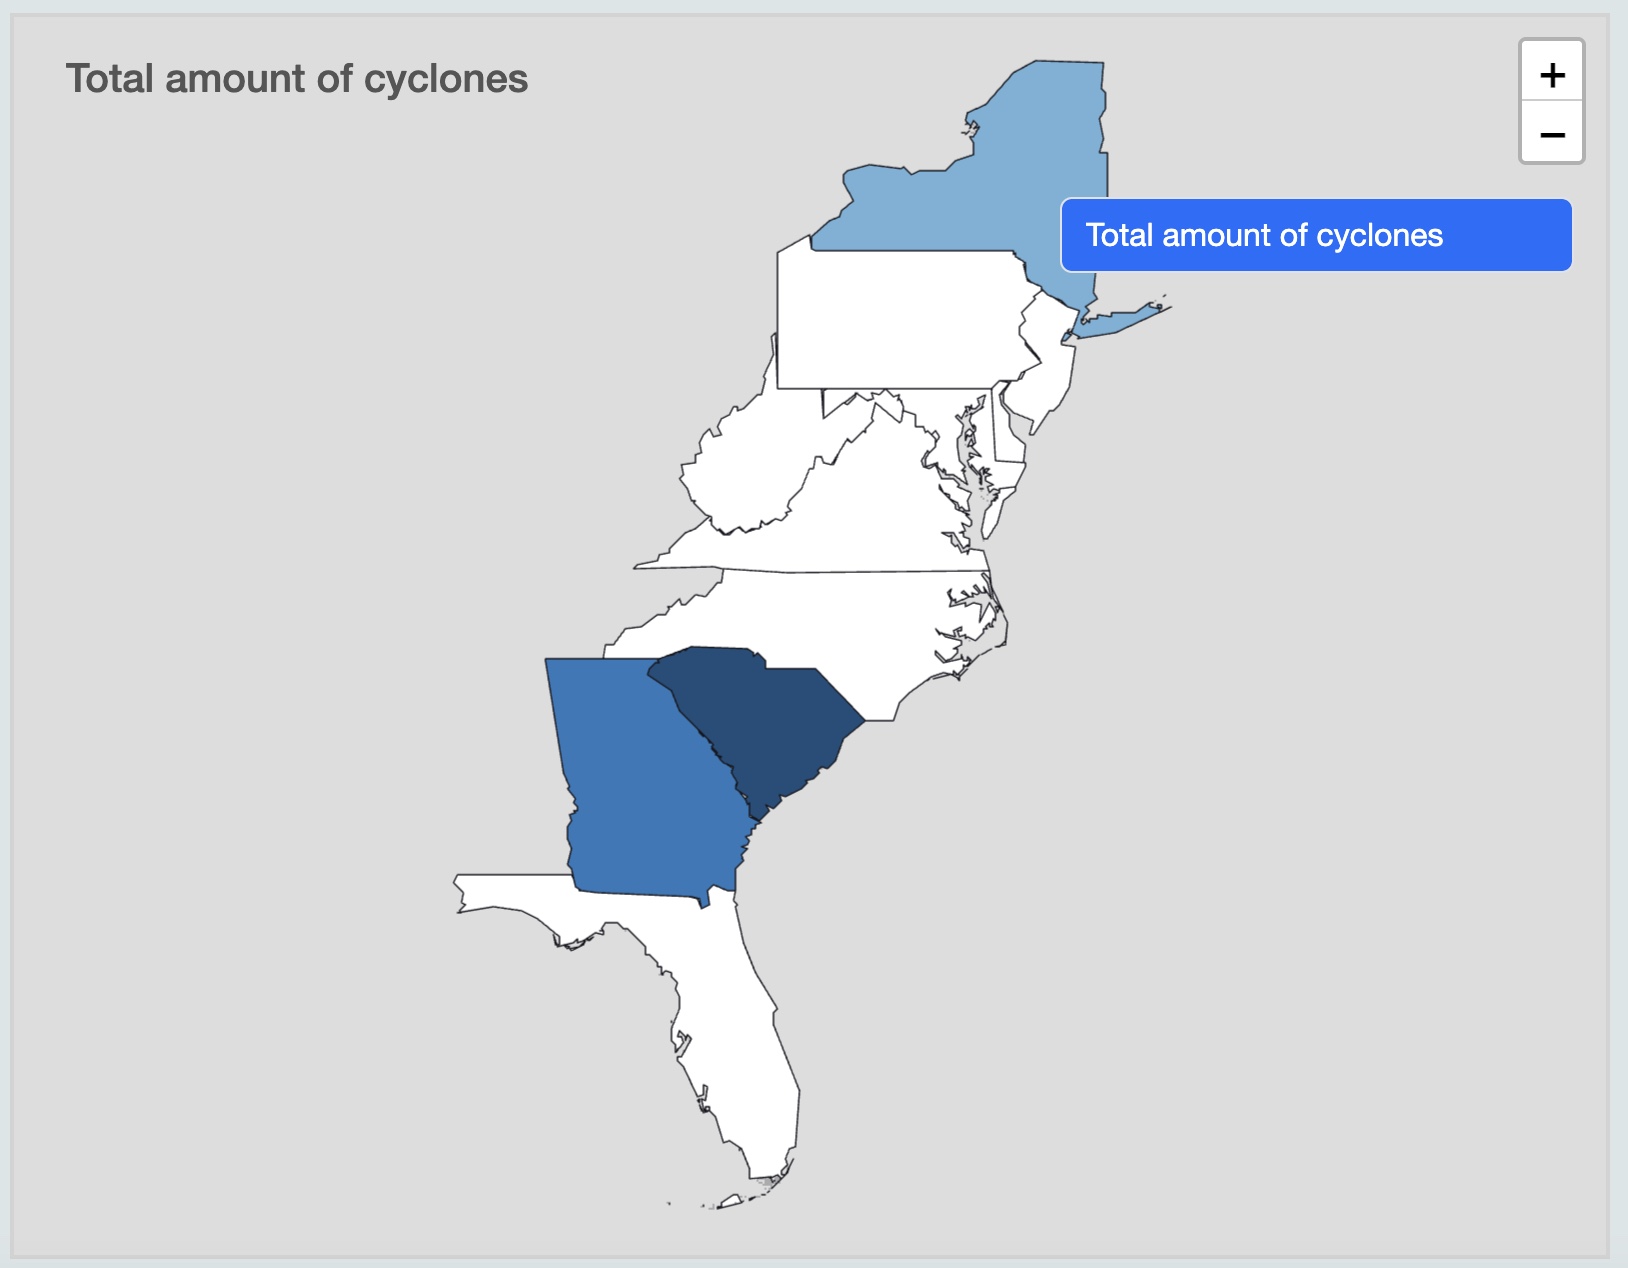
Weather Map
This map consists of choropleth maps focusing on the weather.
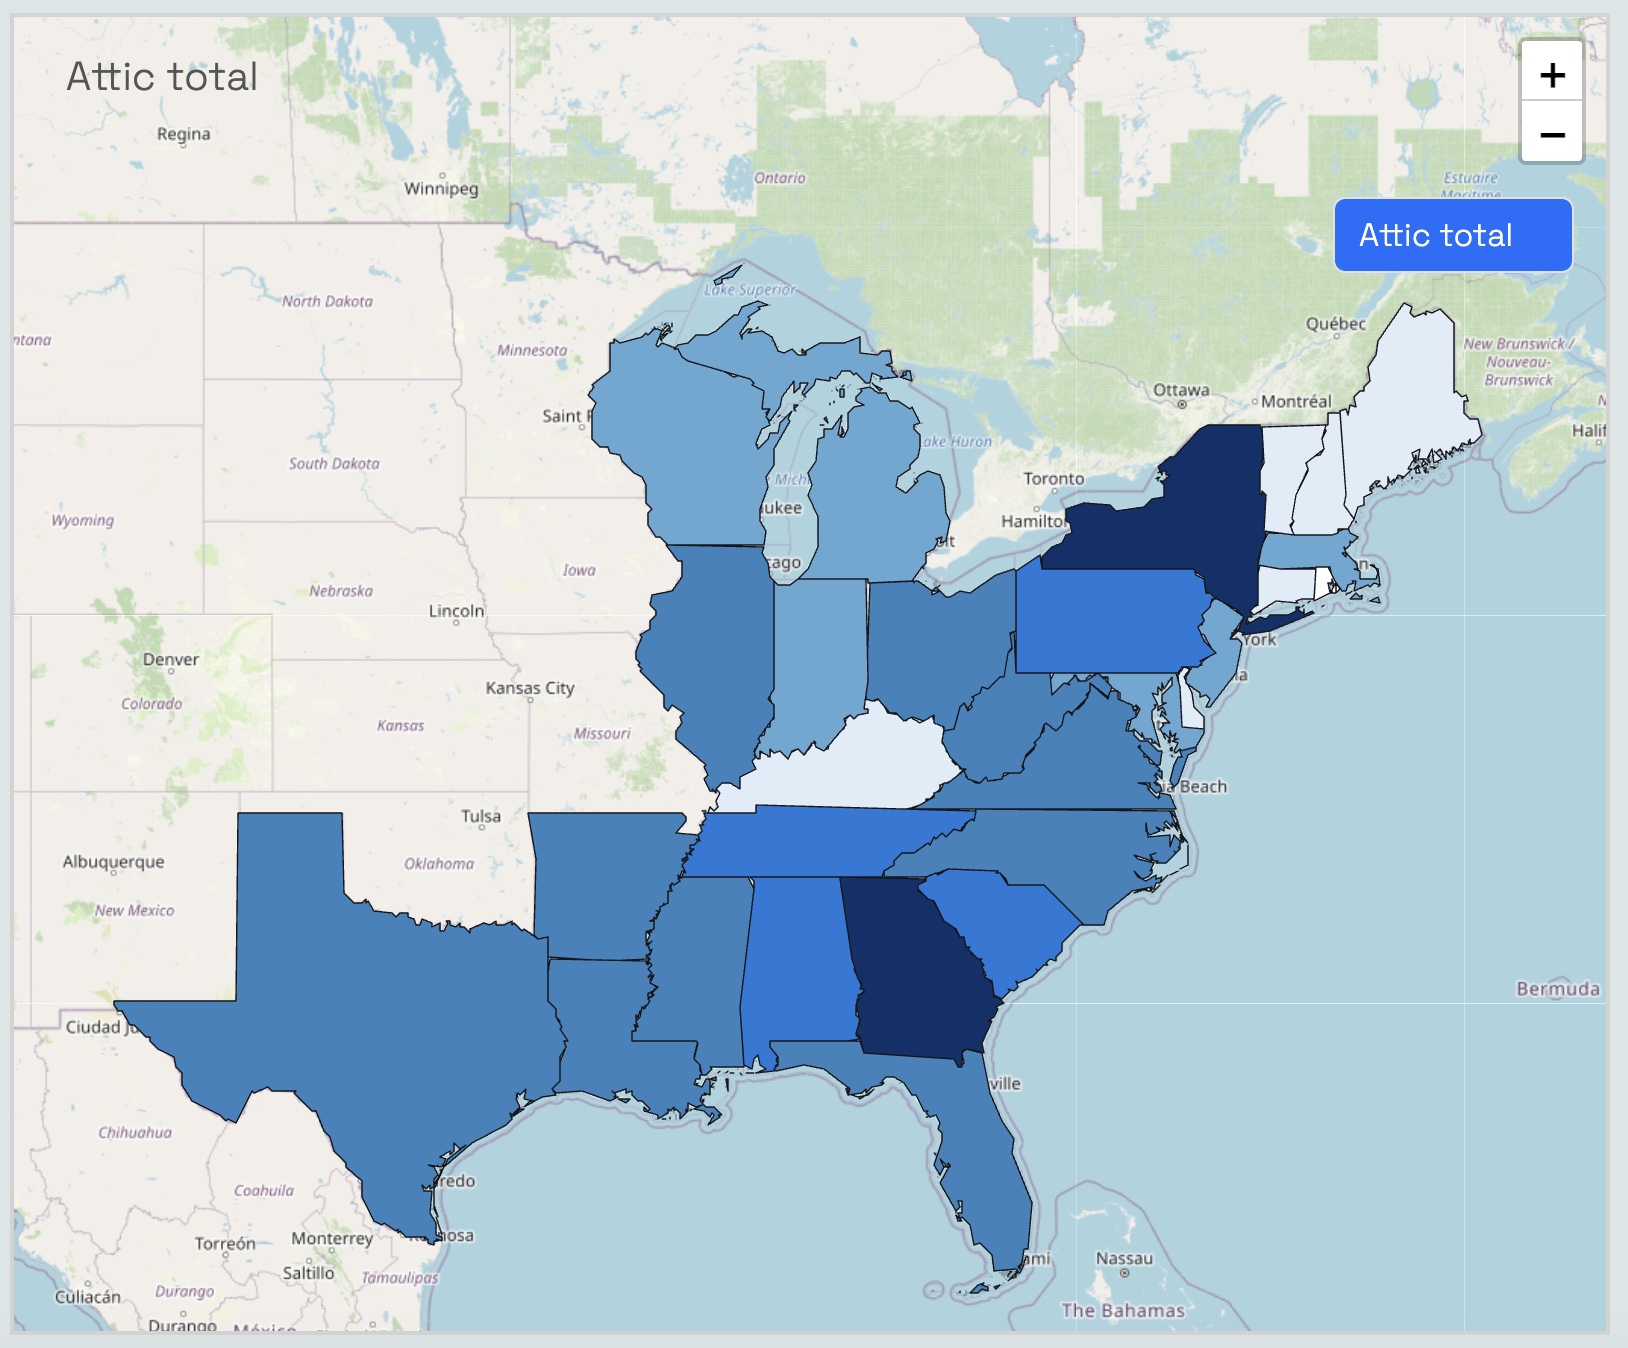
LAP-Attics-Mantels Map
This map consists of choropleth maps focusing on attics and mantels.
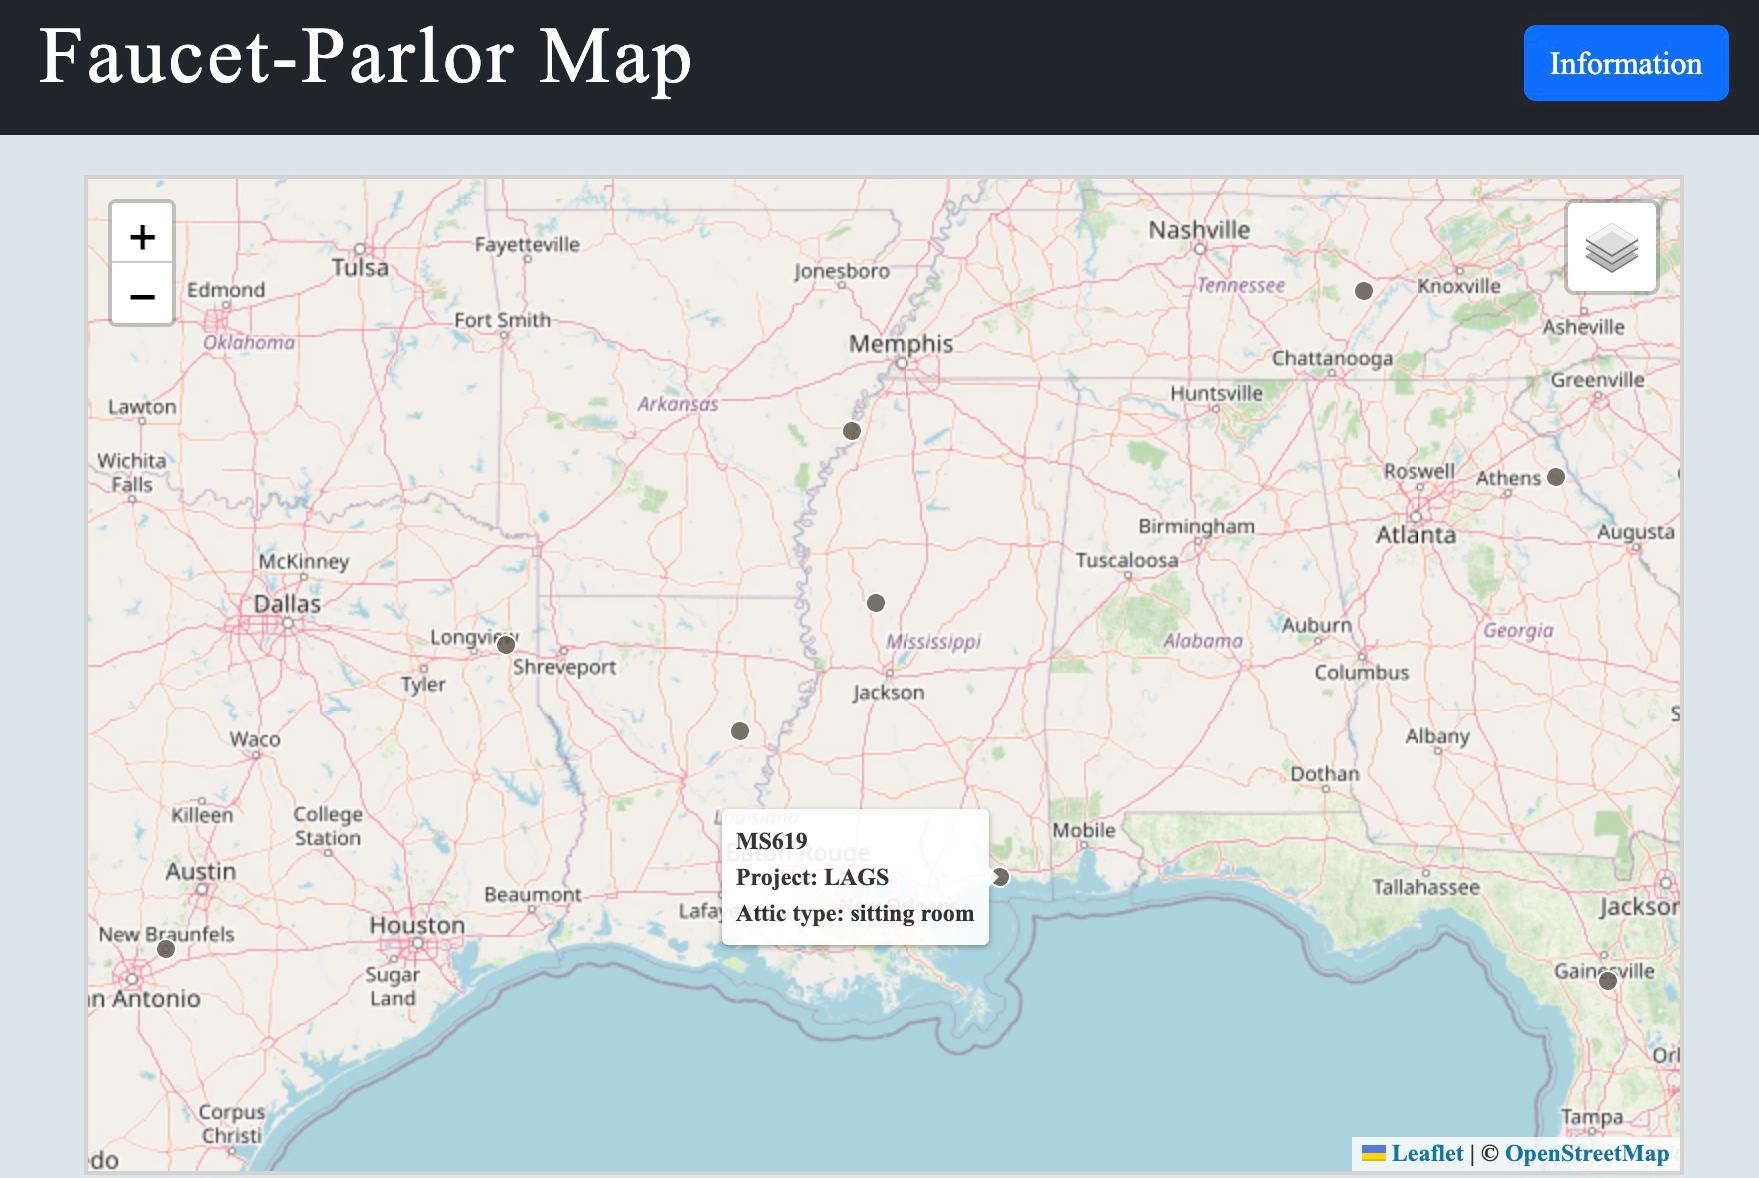
Faucet-Parlor Map
This map consists of checkboxes maps focusing on faucets, parlors, cornbreads, and sweet corn.
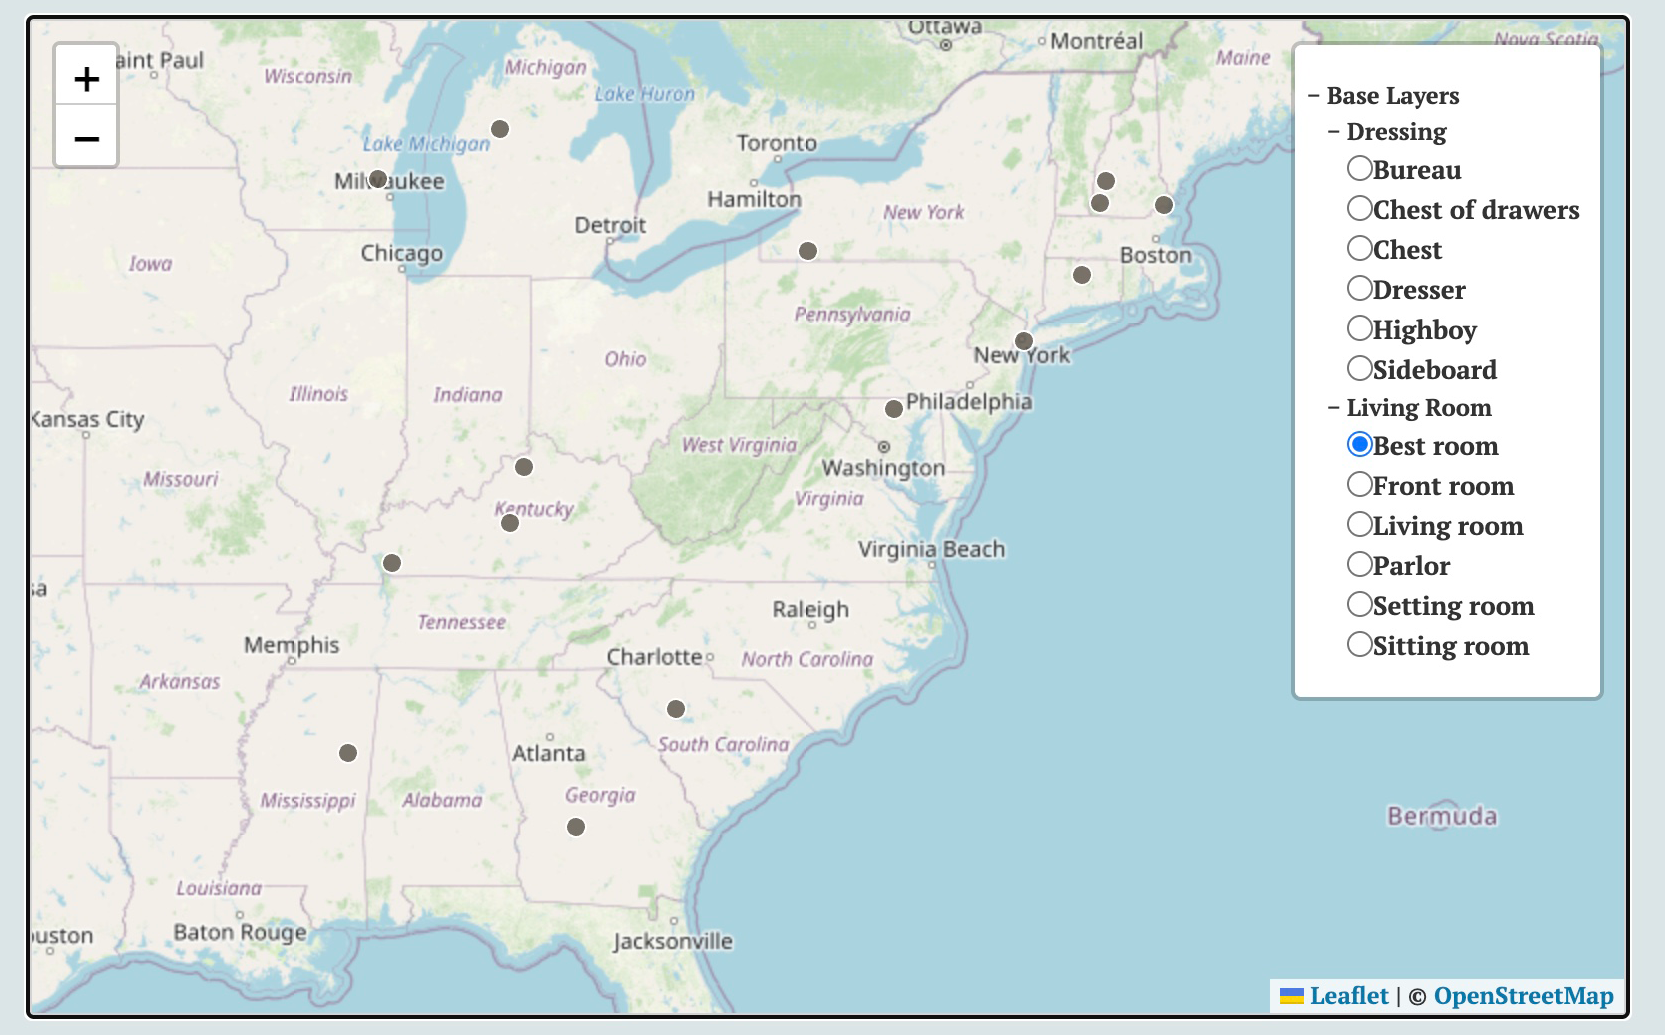
Living-Room-Dresser-Map
A series of maps that consists of living room and dresser total.
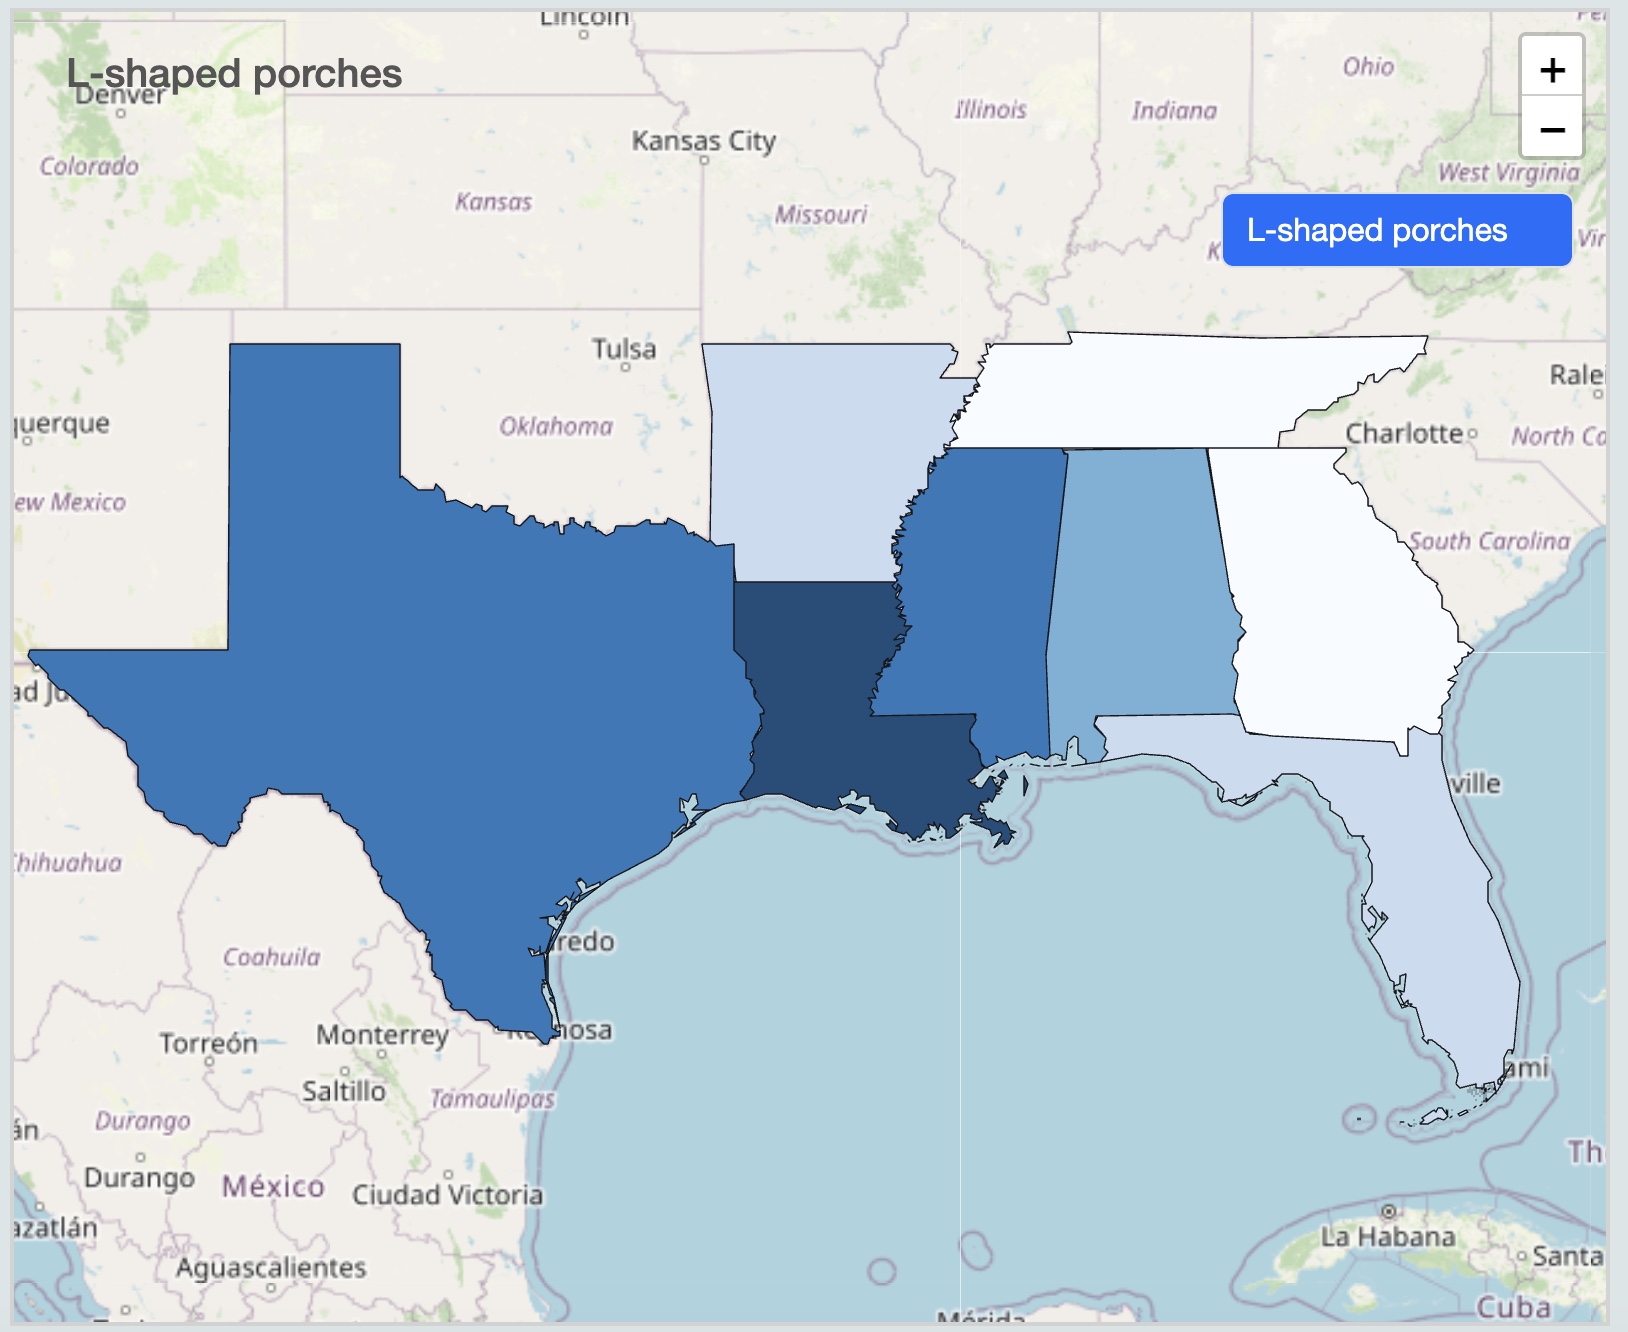
PorchMap 10.8
This map contains choroplethmaps of different porches such as l-shaped porches, screened-in porches, back porches, balcony total, wraparound porches, walkout total, and gallery total.