GitHub Projects
Hawaii Lava Flow Project
Volcano lava flow hazard mapping with road impact analysis.
Places of Interest in DC
Museums and cultural sites in Washington DC with spatial context.
Kenya Mapbox
Monochrome basemap of Kenya created using Mapbox styles.
NYC Subway Museum Map
Museums in NYC with subway routing context.
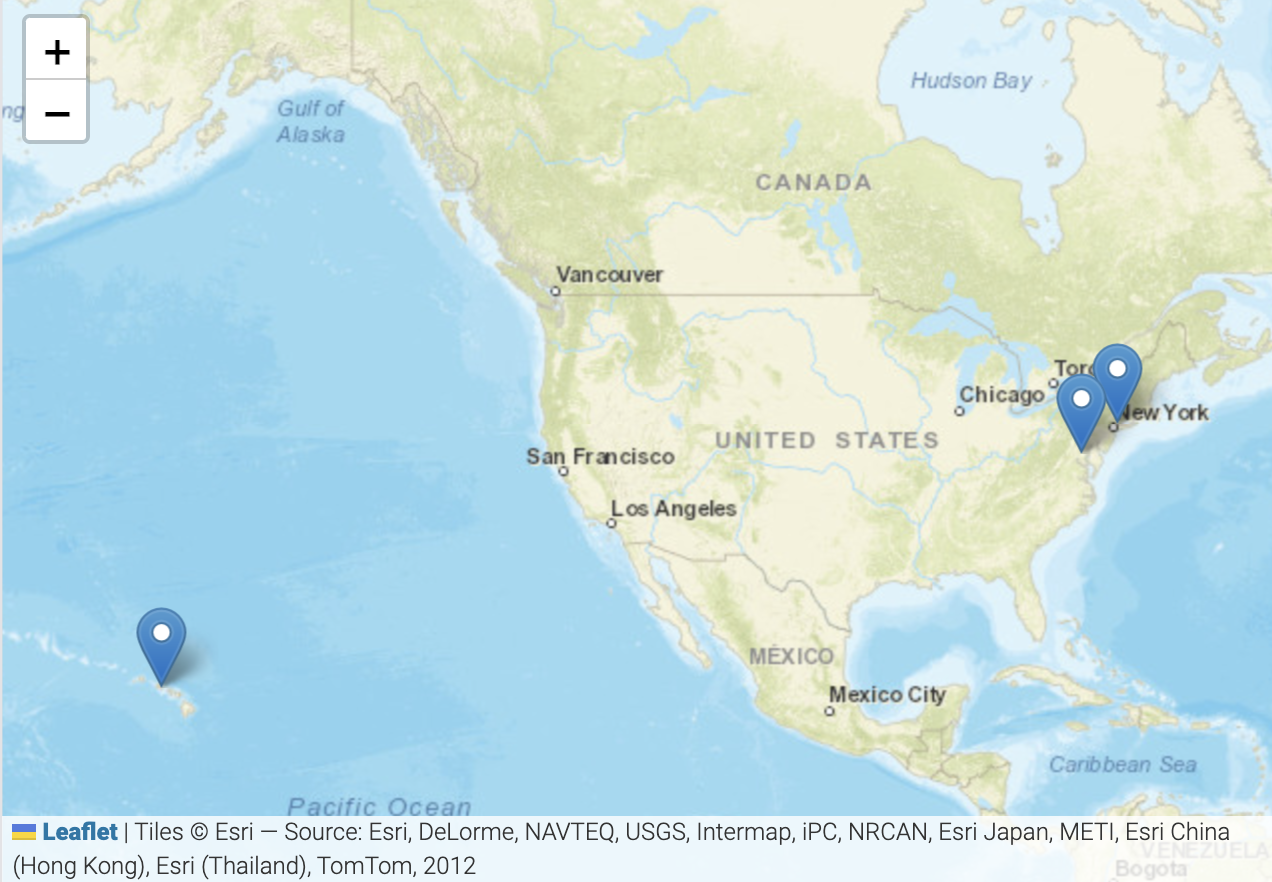
JavaScript Placemark Map
Interactive map using JavaScript arrays, loops, and popups.

Waihou Solar Power Plants
Solar energy production mapping in Oahu, Hawaii.
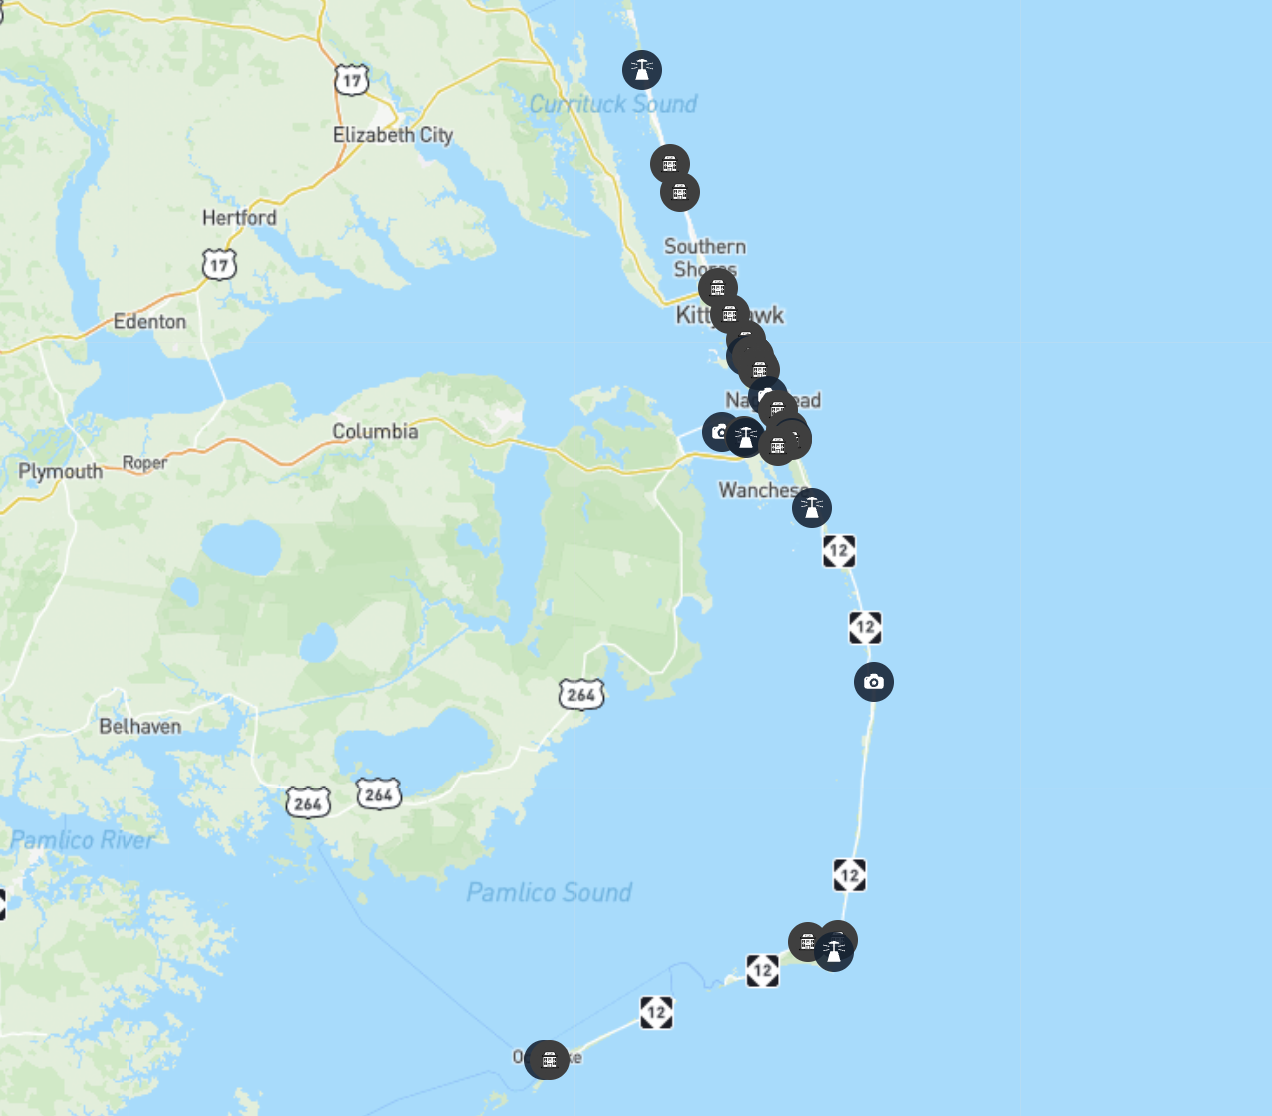
Outer Banks Project
SVG-based attraction mapping of the Outer Banks region.
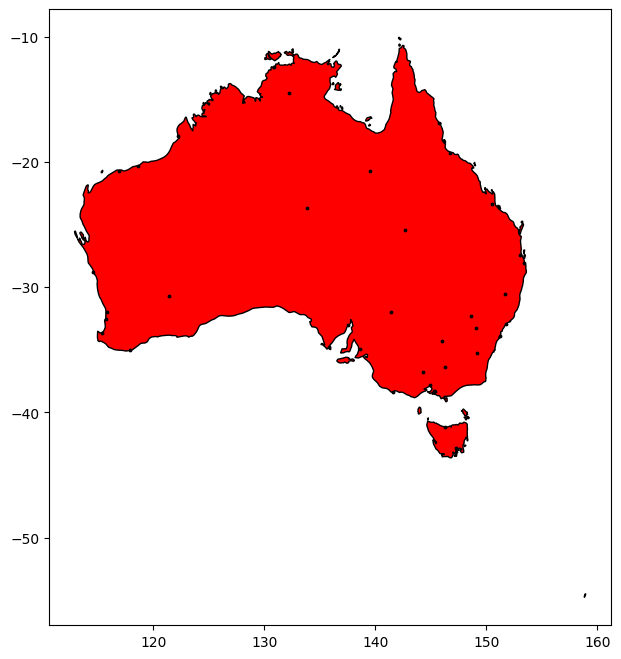
Sydney Energy Consumption
Python + Jupyter Notebook workflow for spatial energy analysis.
Linguistic Atlas Project Internship Work
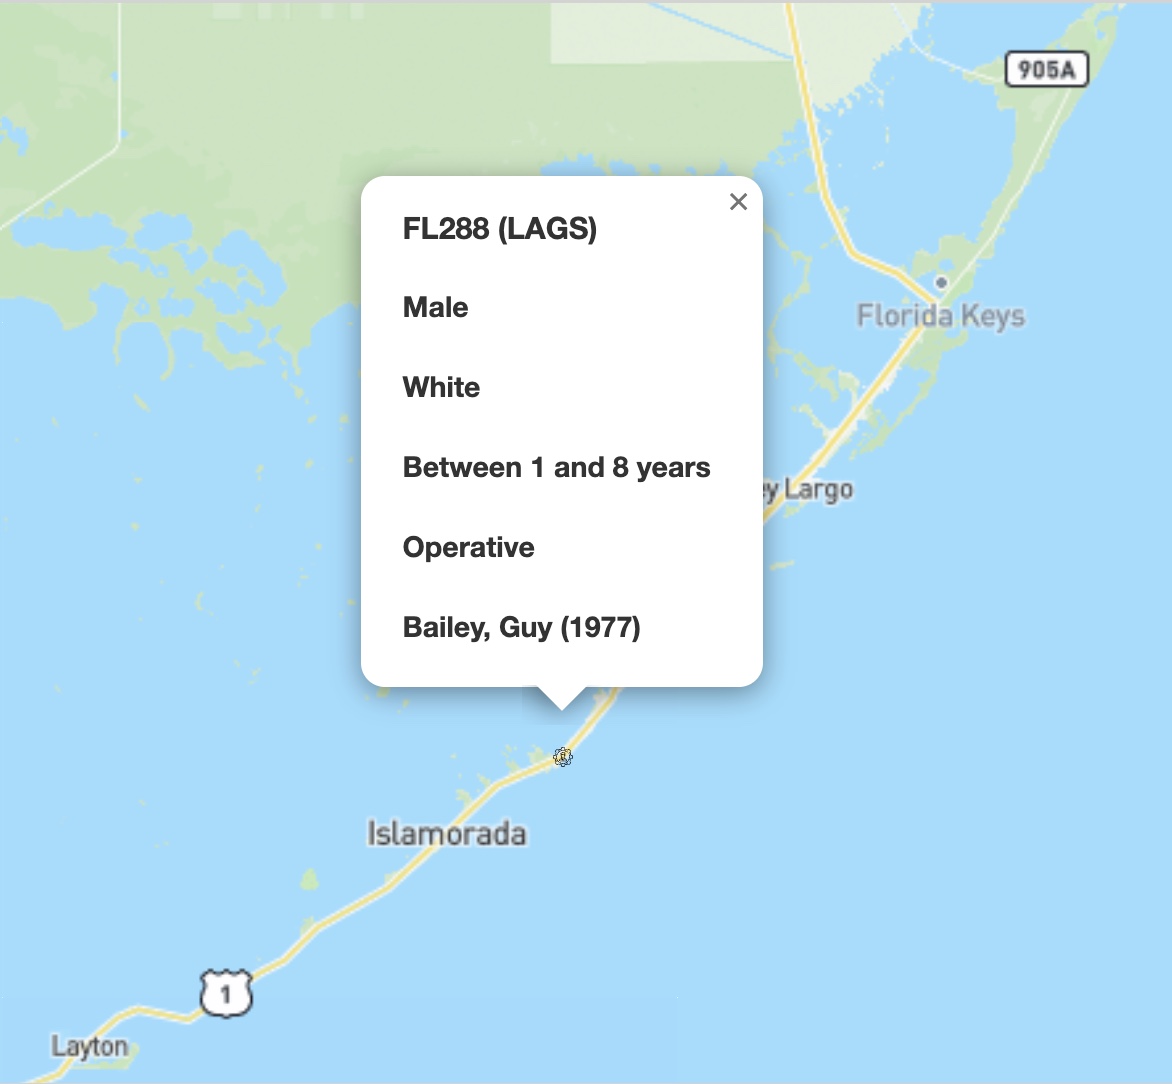
Informant Map Version 1
Deploying coordinate-based geospatial mapping models to plot foundational informant interview points within the LAMSAS project framework.
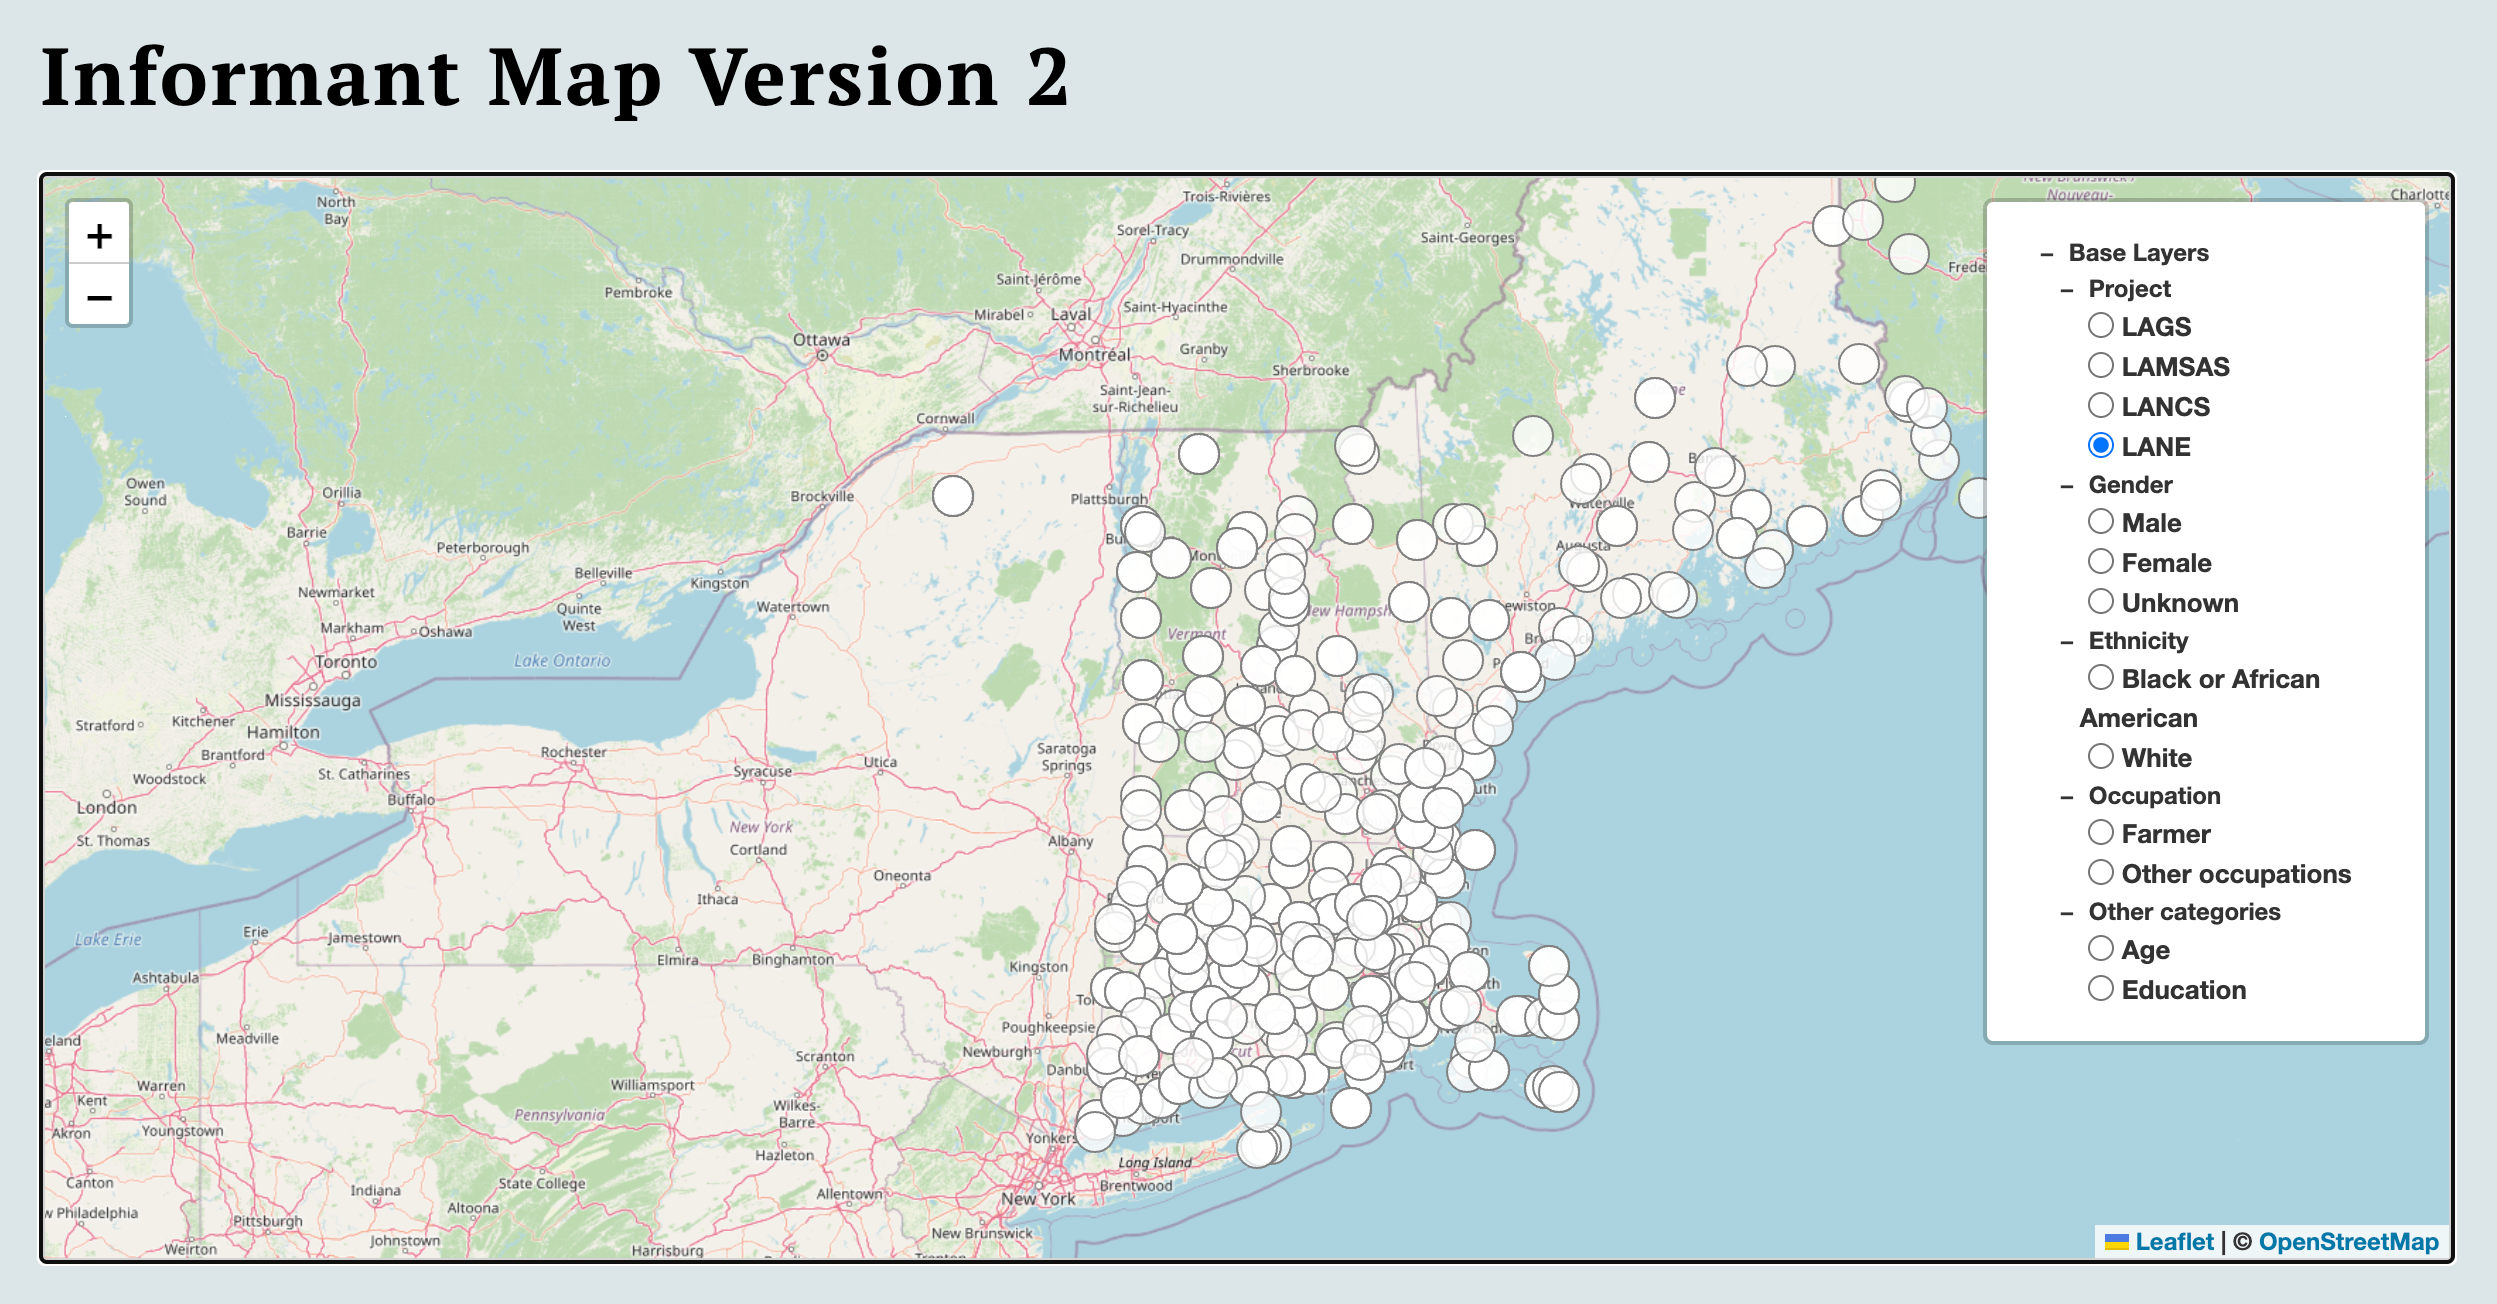
Informant Map Version 2
An attribute-enhanced mapping interface integrating spatial demographic distributions alongside complex professional and occupational data engines.
Informant Map Version 3
Developing interactive checkbox query matrices to filter dense linguistic atlas datasets dynamically based on user-selected geographic parameters.
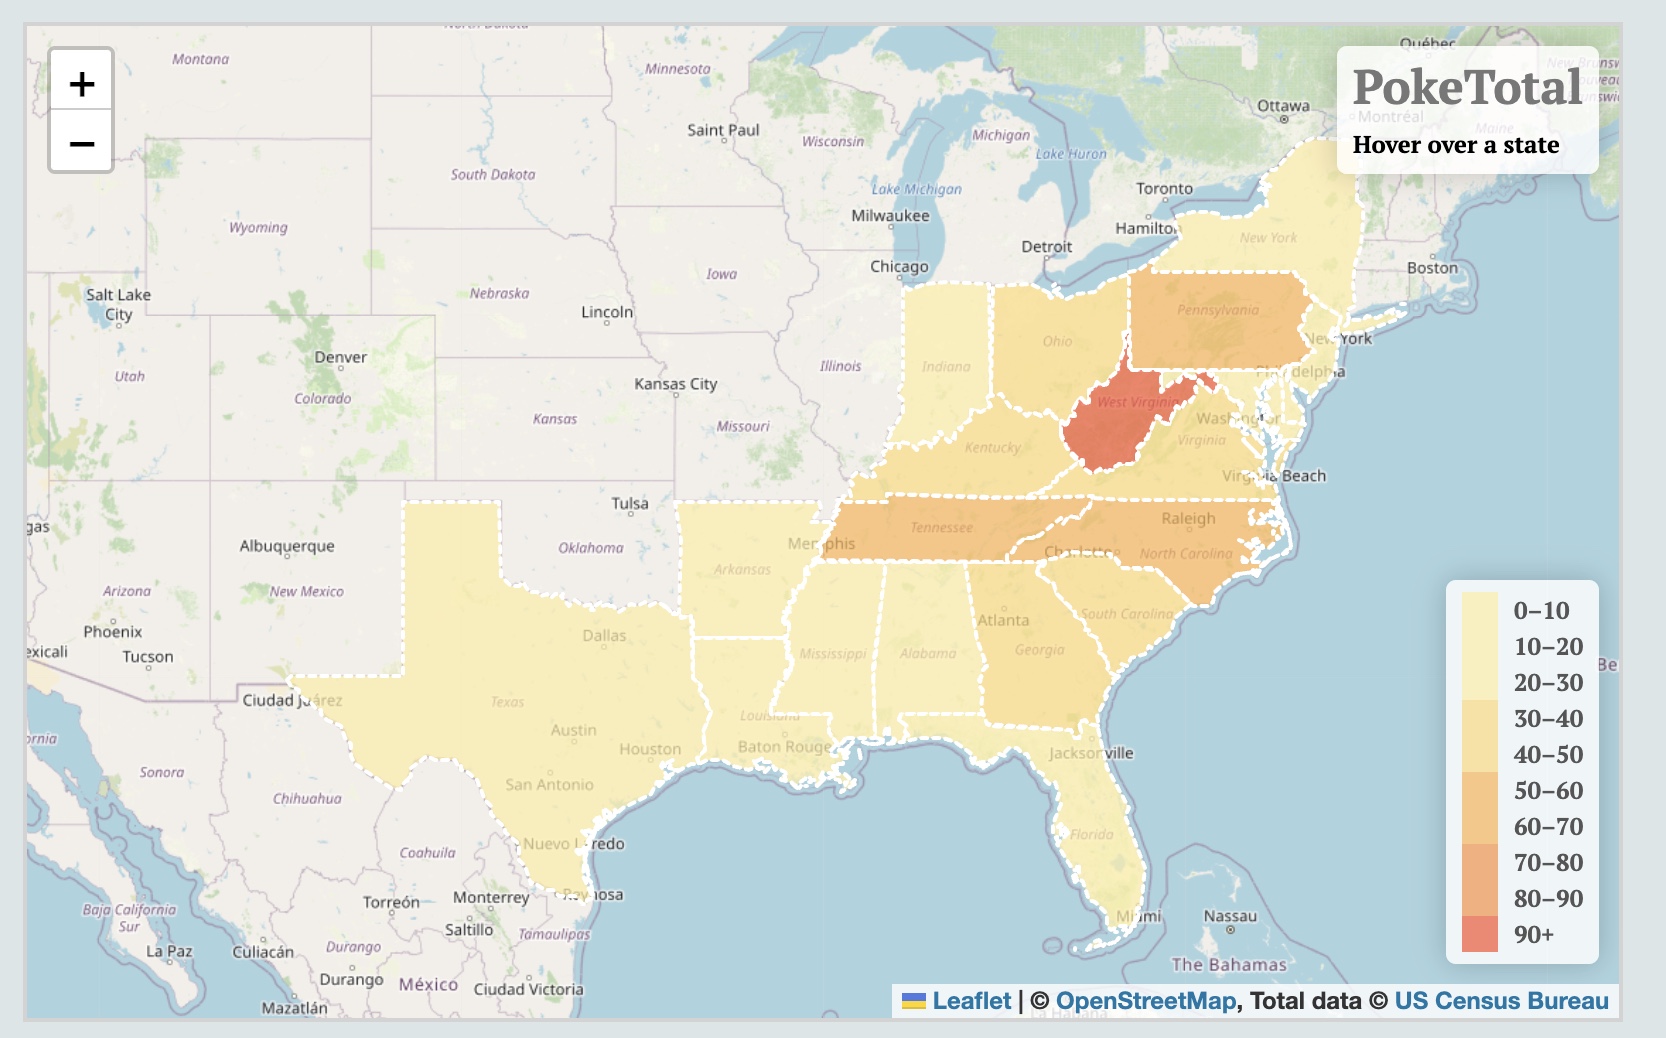
PokeSackTotal
Visualizing geographic variation boundaries and spatial densities across discrete regional terminology datasets.
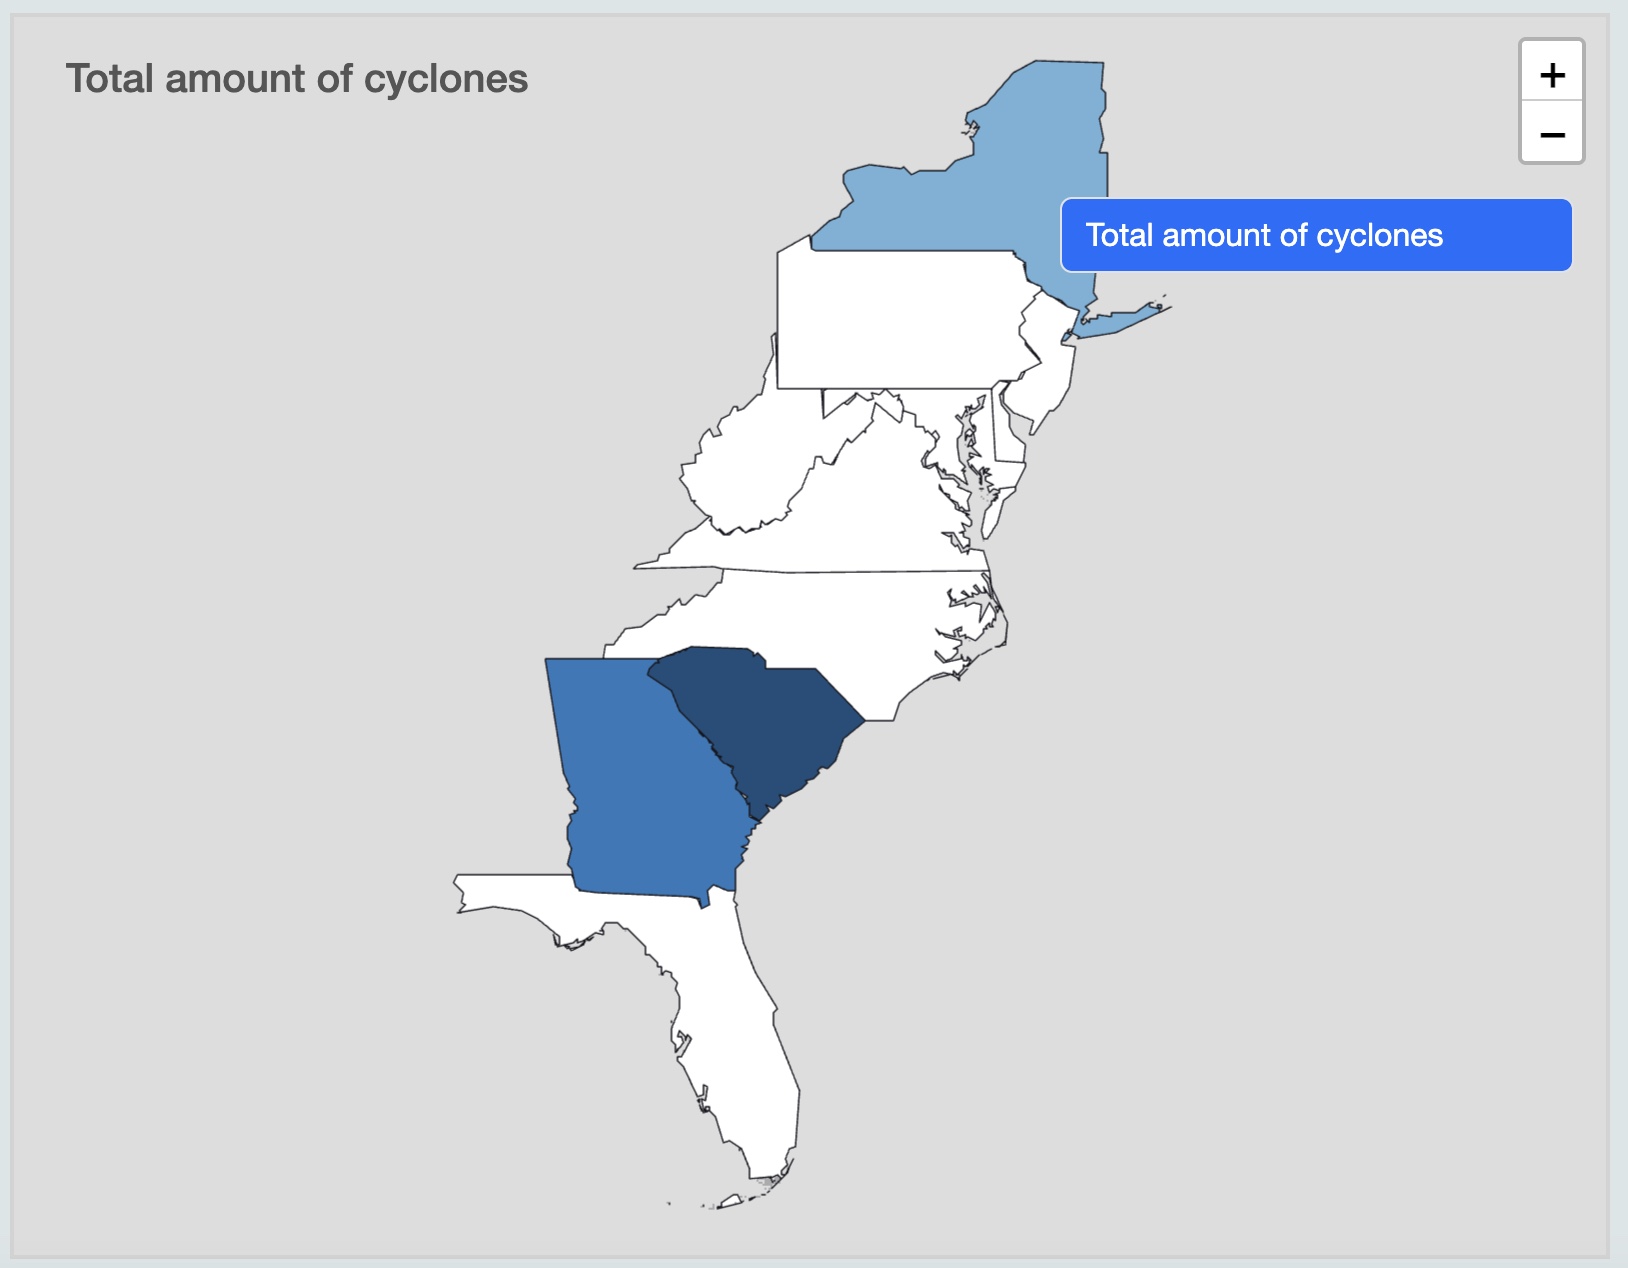
Weather Map
Utilizing clean vector layers and thematic classification styles to generate crisp choropleth maps detailing changing regional weather variations.
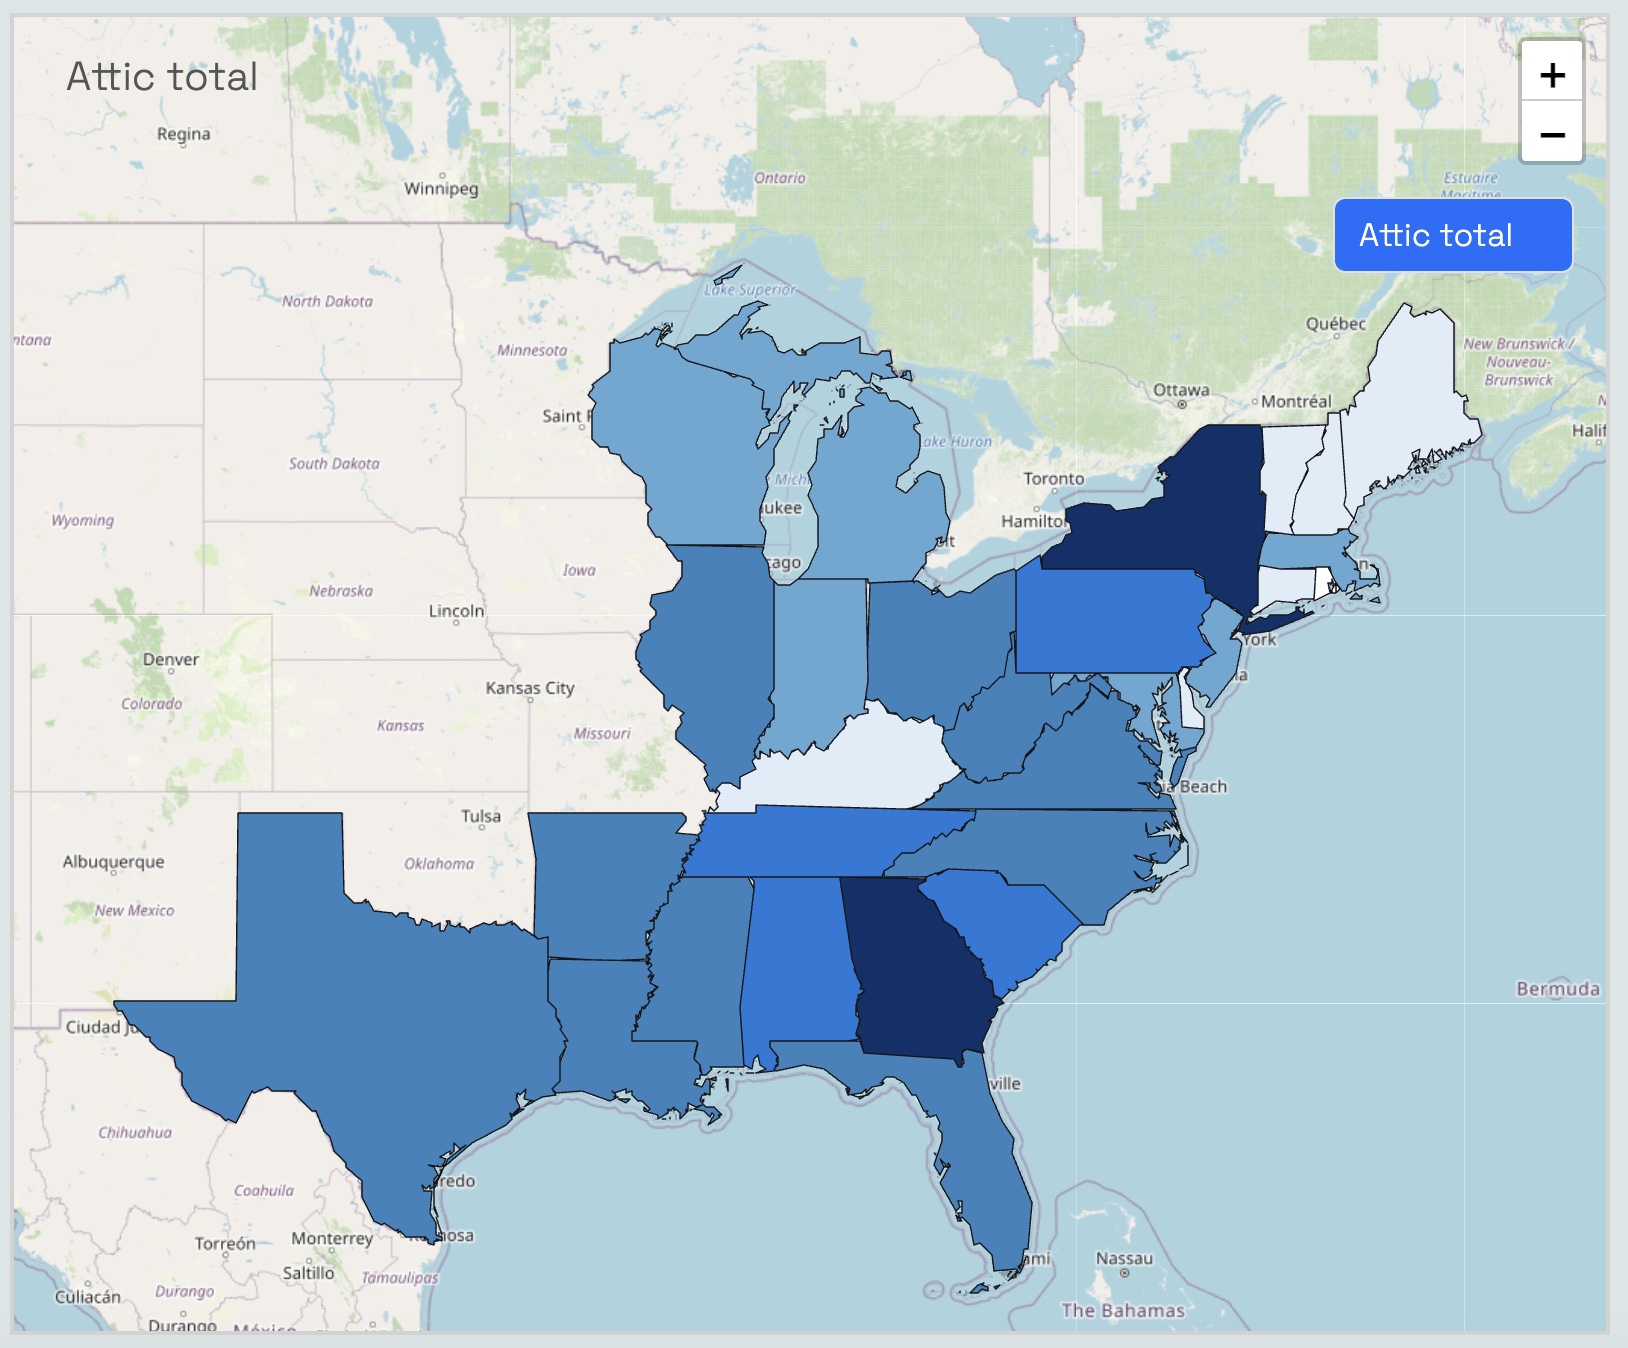
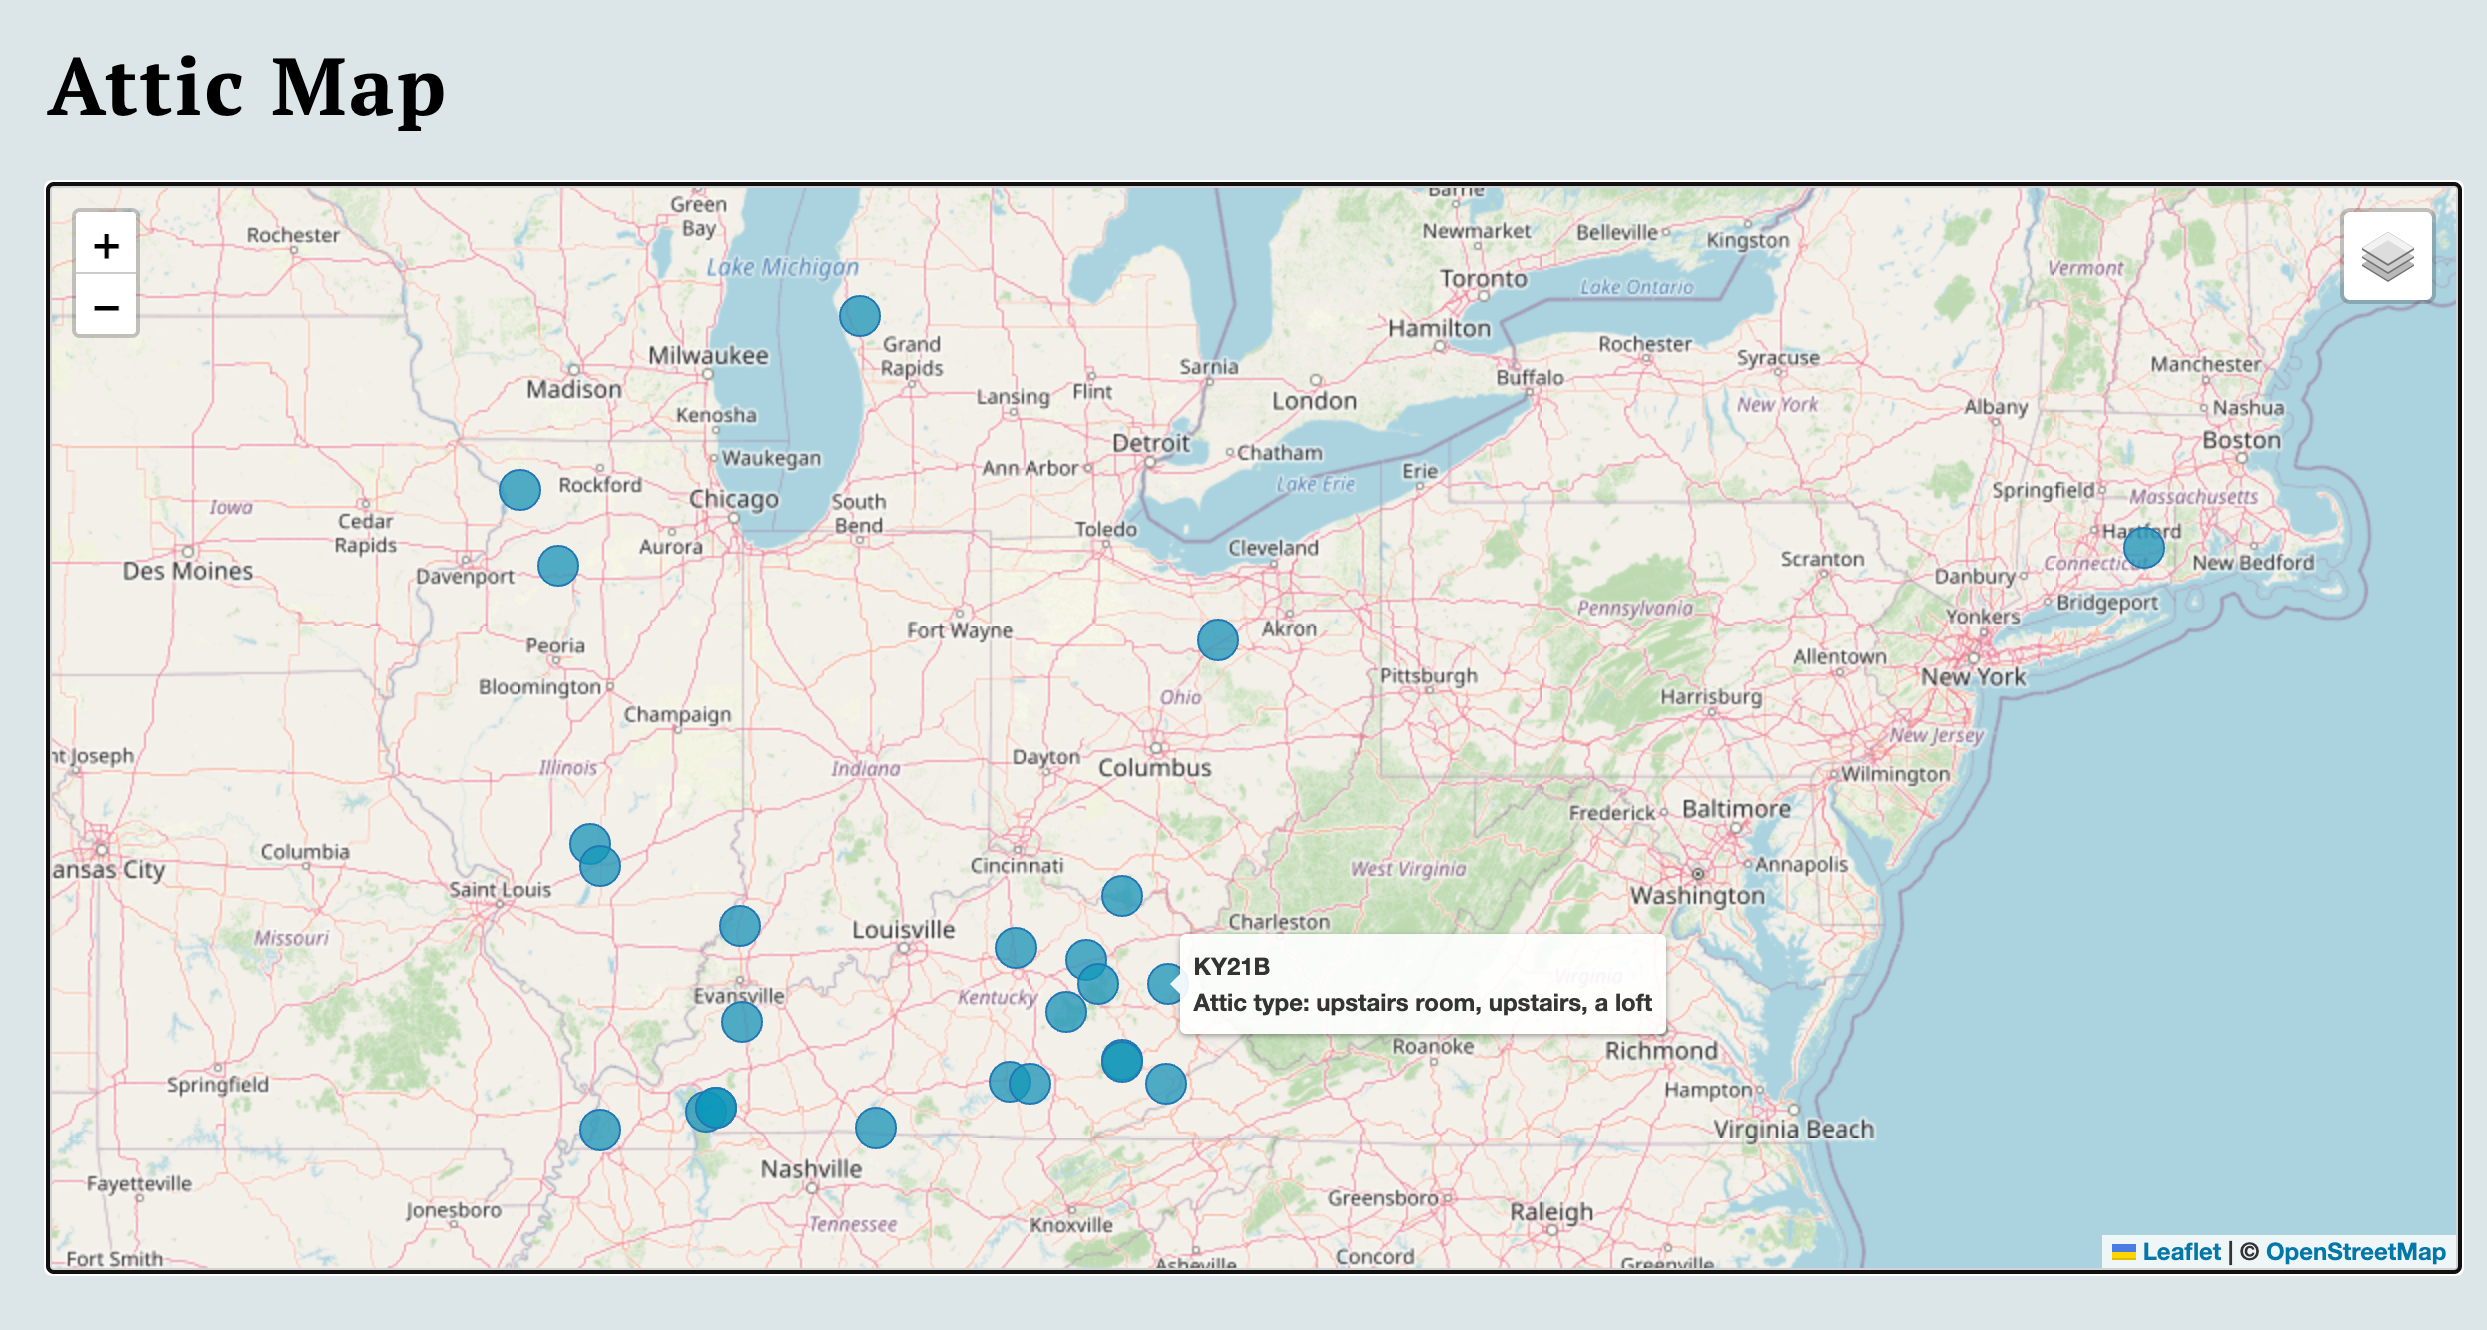
LAP-Attics-Mantels Map
This cartographic interface implements a series of choropleth models to isolate and analyze regional linguistic datasets regarding domestic spaces.
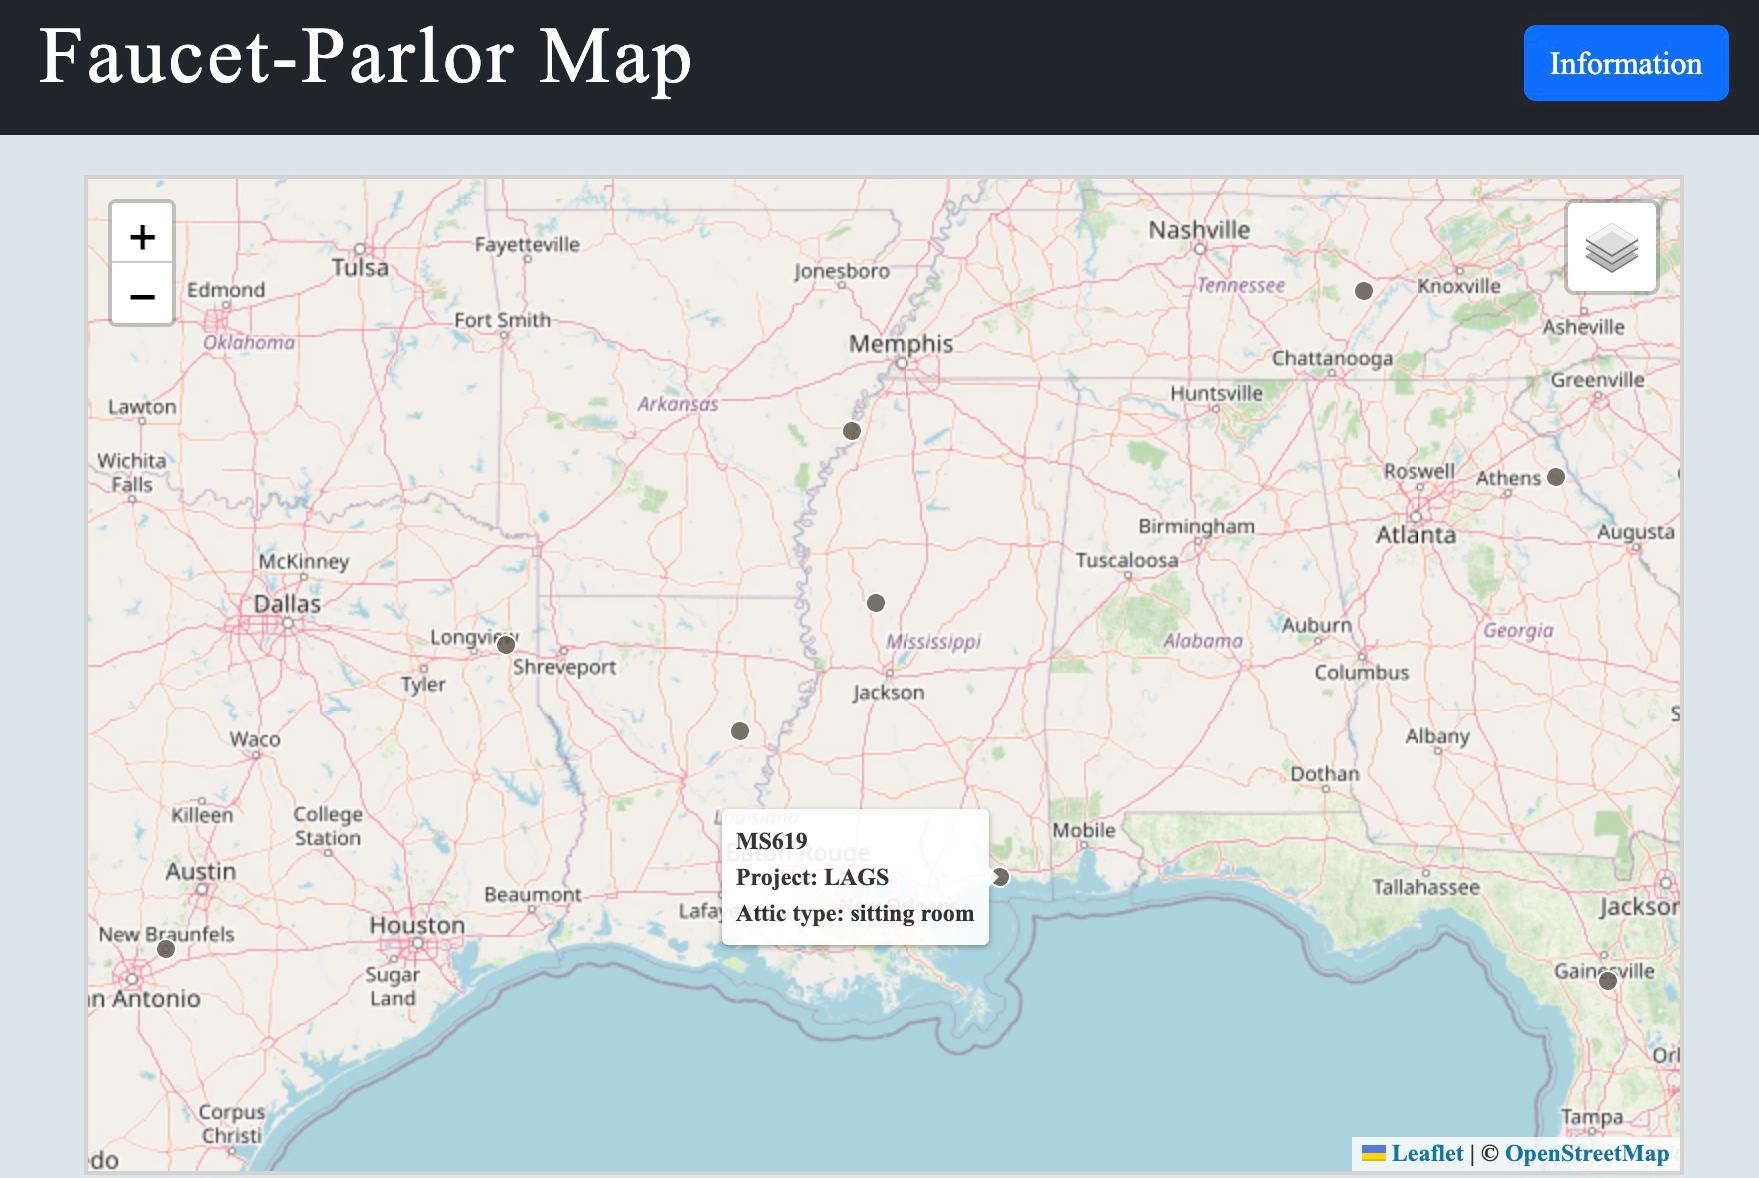
Faucet-Parlor Map
An interactive, checkbox-driven spatial filtering application designed to plot, isolate, and cross-reference geographic linguistic variations for diverse regional terminology datasets.
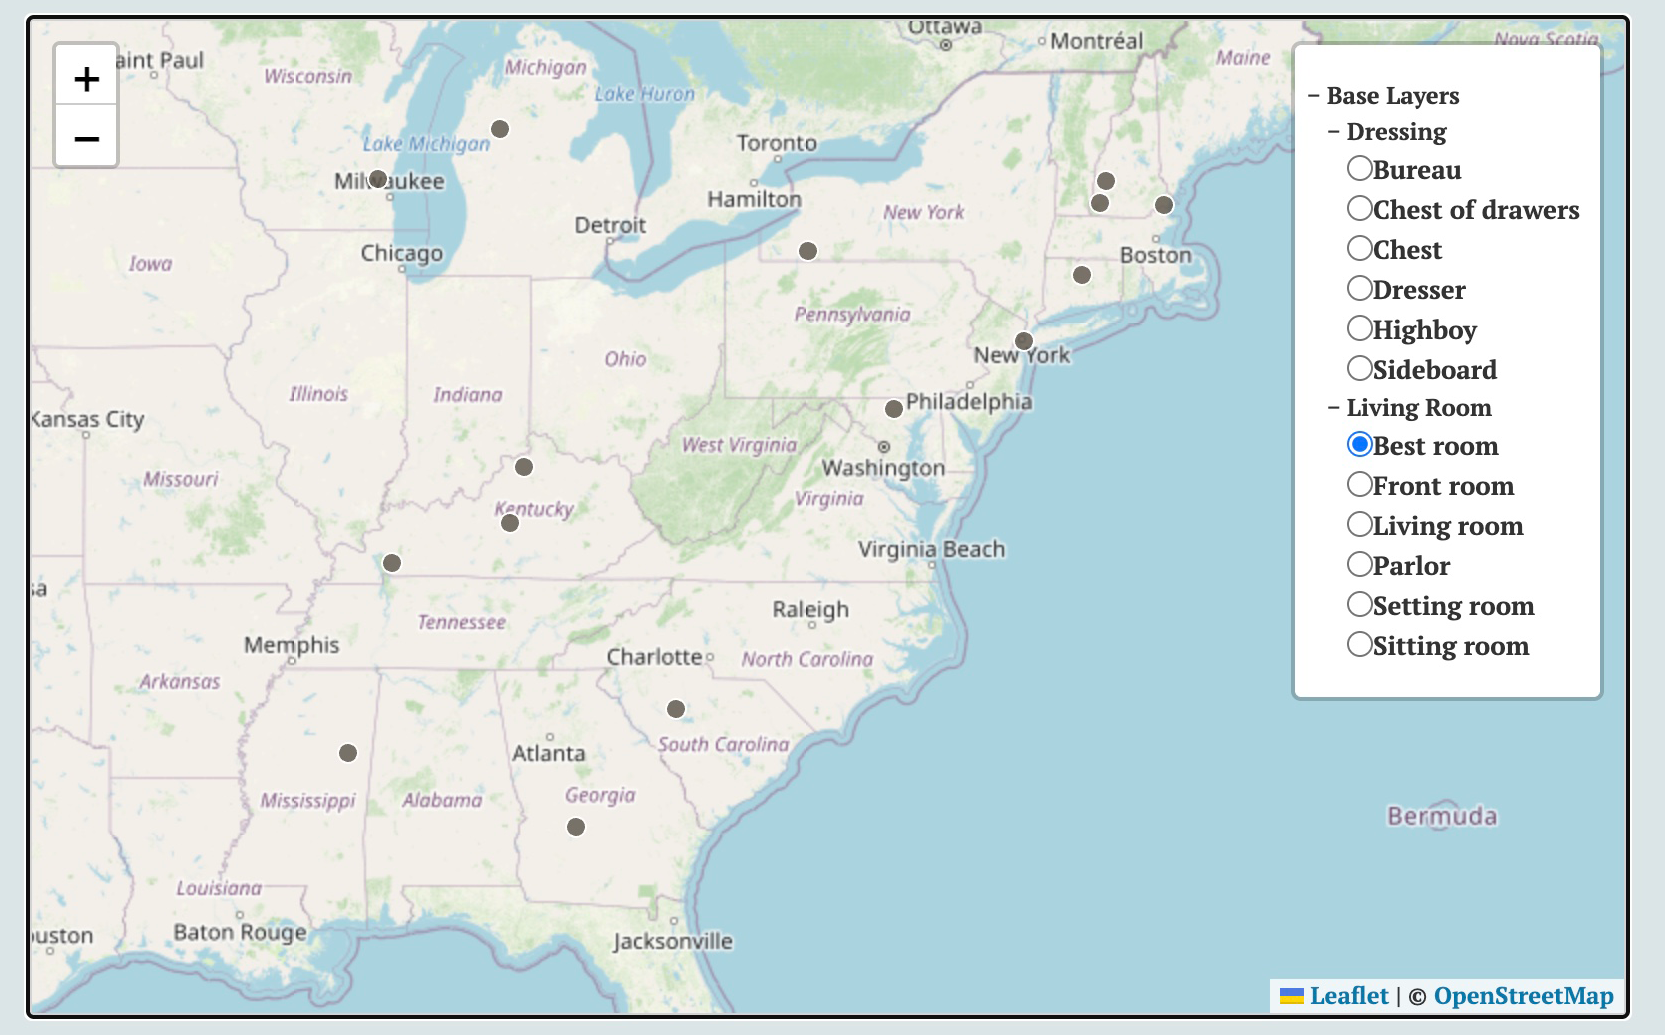
Living-Room-Dresser-Map
A series of thematic web maps utilizing custom data classification models to analyze and compare the localized geographic densities of domestic spatial terms.
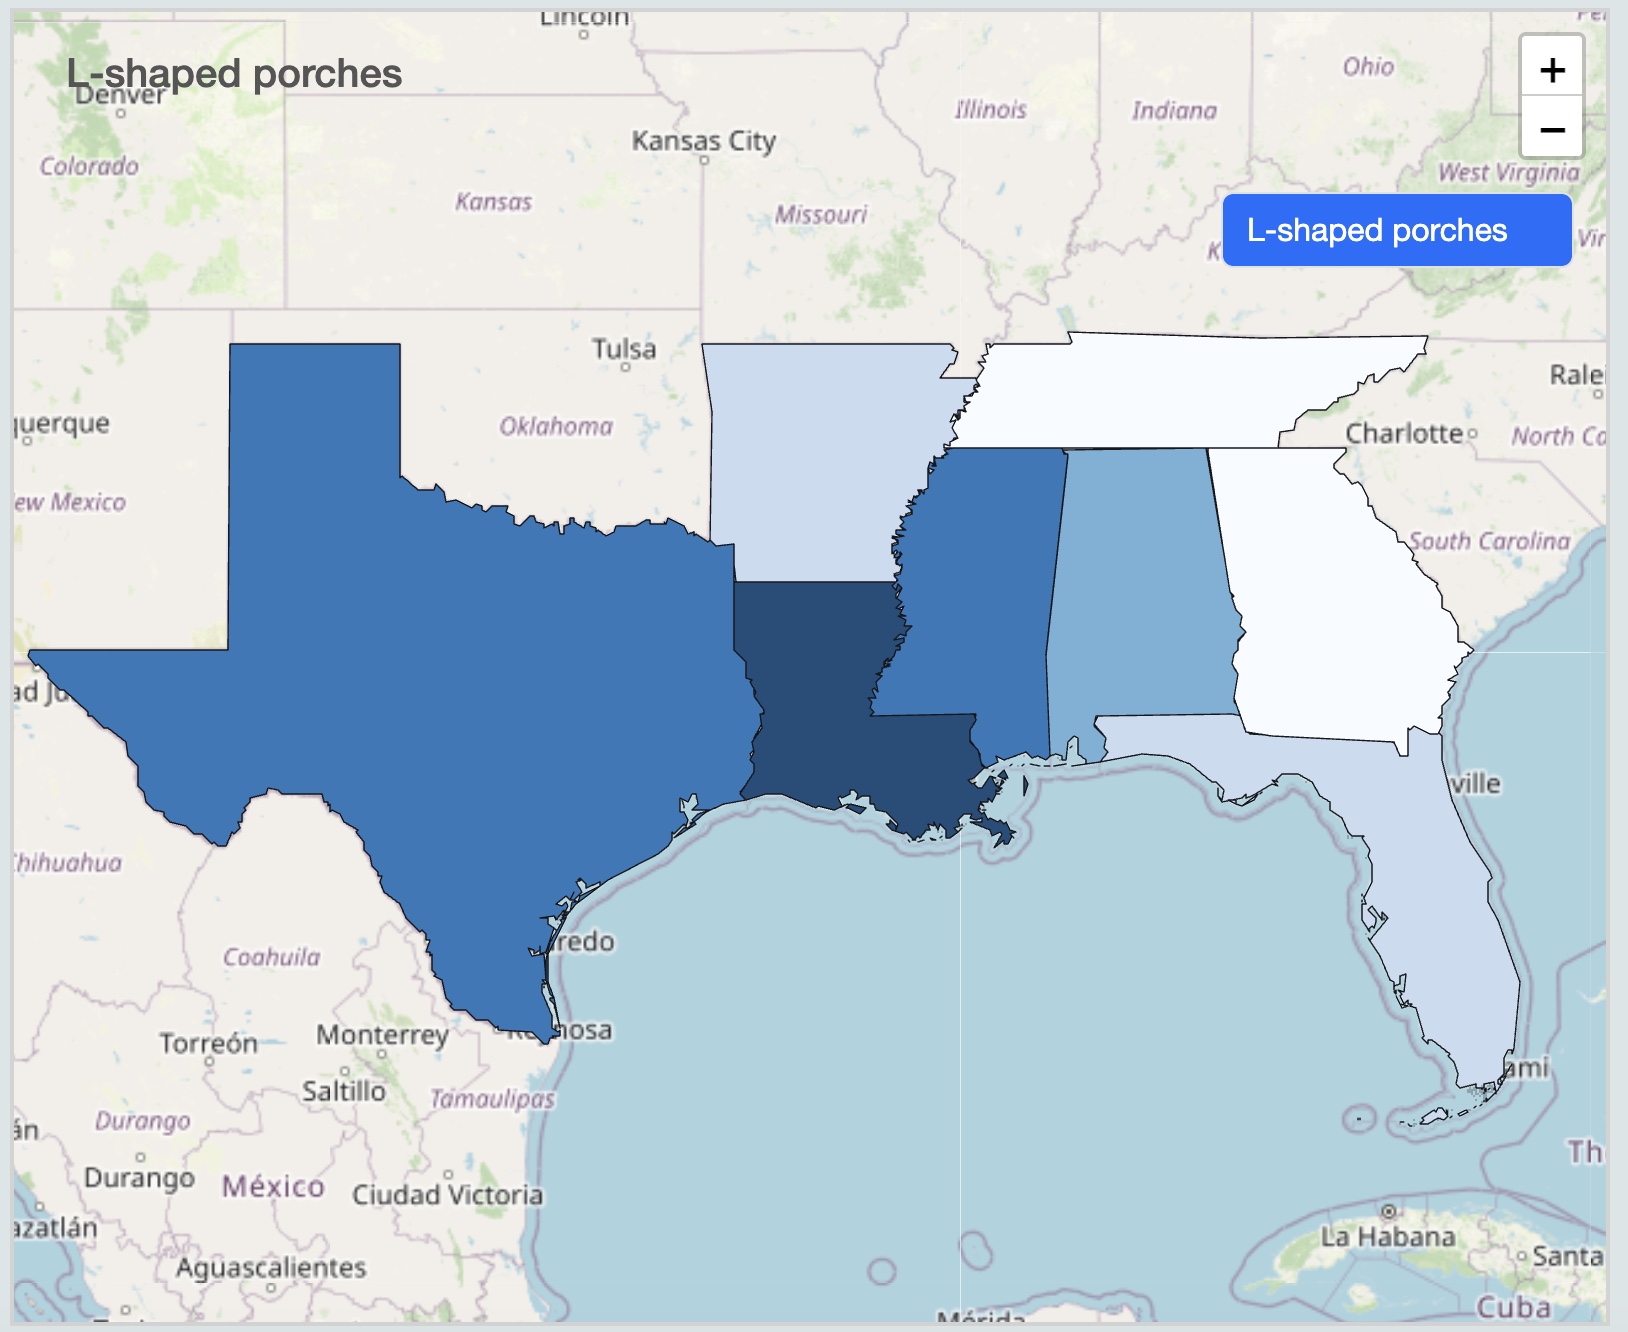
PorchMap 10.8
A multi-layered thematic mapping dashboard leveraging detailed choropleth classifications to visualize the density, geographic distribution, and regional variation of structural domestic design elements.